
On October 8, a Financial Times report questioning OpenAI’s revenue knocked the air out of AI stocks. The Nasdaq fell 1.3%, its worst day since mid-August. The S&P 500 slipped 0.5% and the Dow barely moved.[1]
I’m not worried. Not yet. I’ll show you why, and the exact date when I will be.
Two clocks are ticking. One is a seasonal pattern I’ve tracked across a century of market data, and it says stay long until July 18, 2027. The other is AI spending, which is carrying this market and can’t accelerate forever. Both clocks point at the same summer.
Clock #1: the 100-Year Pattern
The window opened on September 27, 2026, and history says it is one of the strongest stretches in the four-year cycle. It runs from late September of a midterm year to mid-July of the following year.
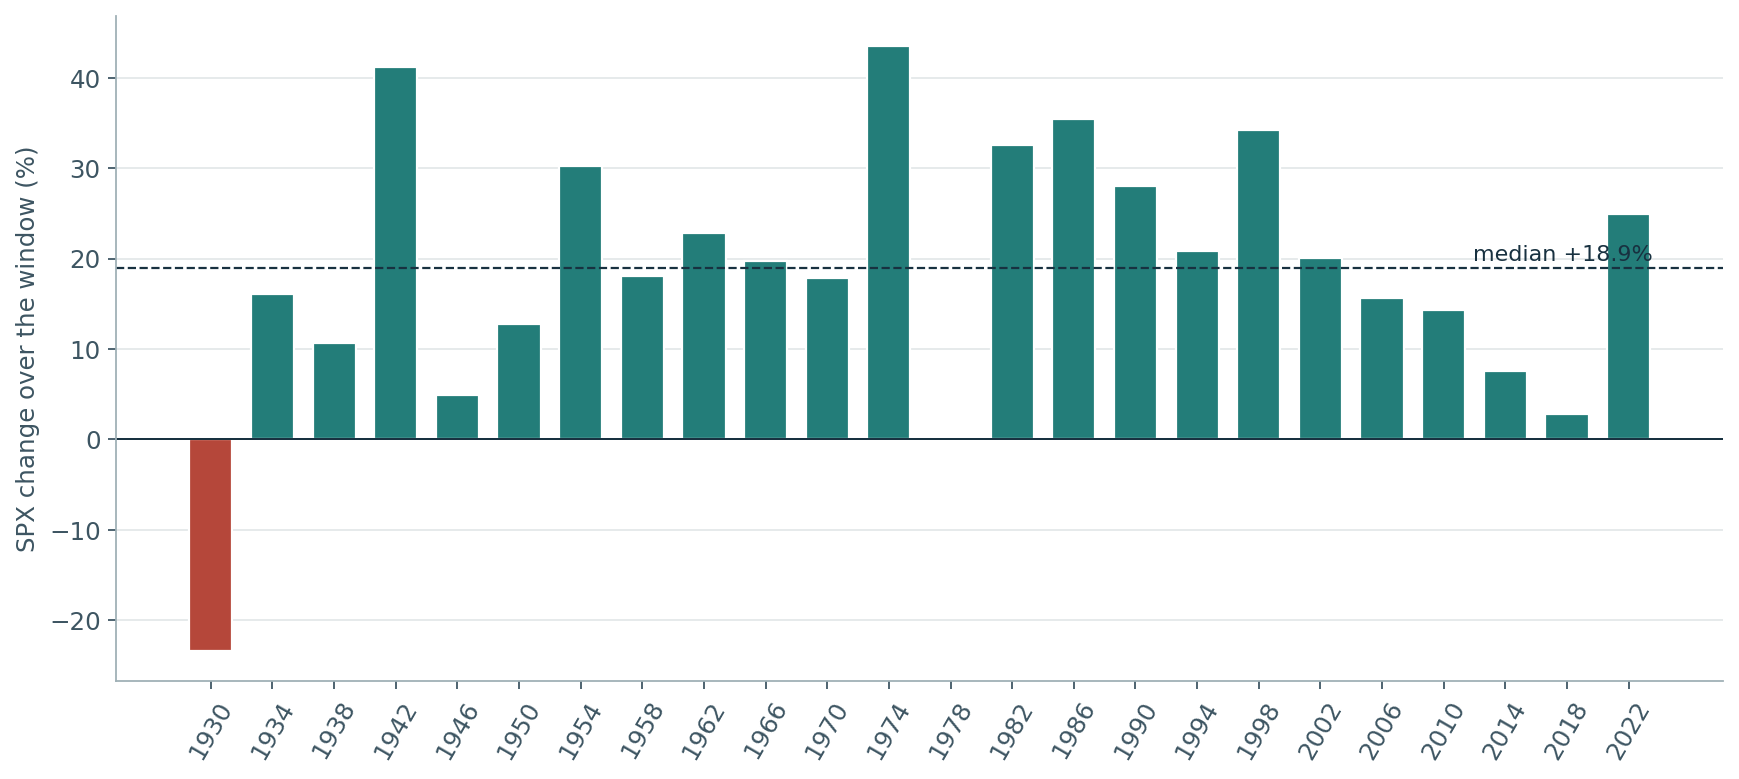
I ran the exact window through TradeWave for every midterm year each index has on record. Same entry date, same 295 days, no cherry-picking.[8]
The S&P 500’s only losing window was 1930, in the depths of the Great Depression. It hasn’t failed since. The Nasdaq 100 has never failed: 10 for 10, and even its weakest year, 2018, finished up 3.6%. The Dow averages add depth with a few misses: the Industrials in 1978 (down 3.7%), the Utilities in 2022 (down 2.6%) and the Transports in 2014 and 2018.[8]
The S&P 500 has not failed this window since 1930
SPX change from Sep 27 to Jul 18 in each midterm year, percent
View chart data
| Window starting year | SPX change |
|---|---|
| 1930 | -23.41% |
| 1934 | +16.12% |
| 1938 | +10.65% |
| 1942 | +41.17% |
| 1946 | +4.90% |
| 1950 | +12.73% |
| 1954 | +30.22% |
| 1958 | +18.13% |
| 1962 | +22.81% |
| 1966 | +19.72% |
| 1970 | +17.90% |
| 1974 | +43.52% |
| 1978 | +0.03% |
| 1982 | +32.62% |
| 1986 | +35.44% |
| 1990 | +28.04% |
| 1994 | +20.87% |
| 1998 | +34.23% |
| 2002 | +20.06% |
| 2006 | +15.68% |
| 2010 | +14.30% |
| 2014 | +7.61% |
| 2018 | +2.78% |
| 2022 | +24.89% |
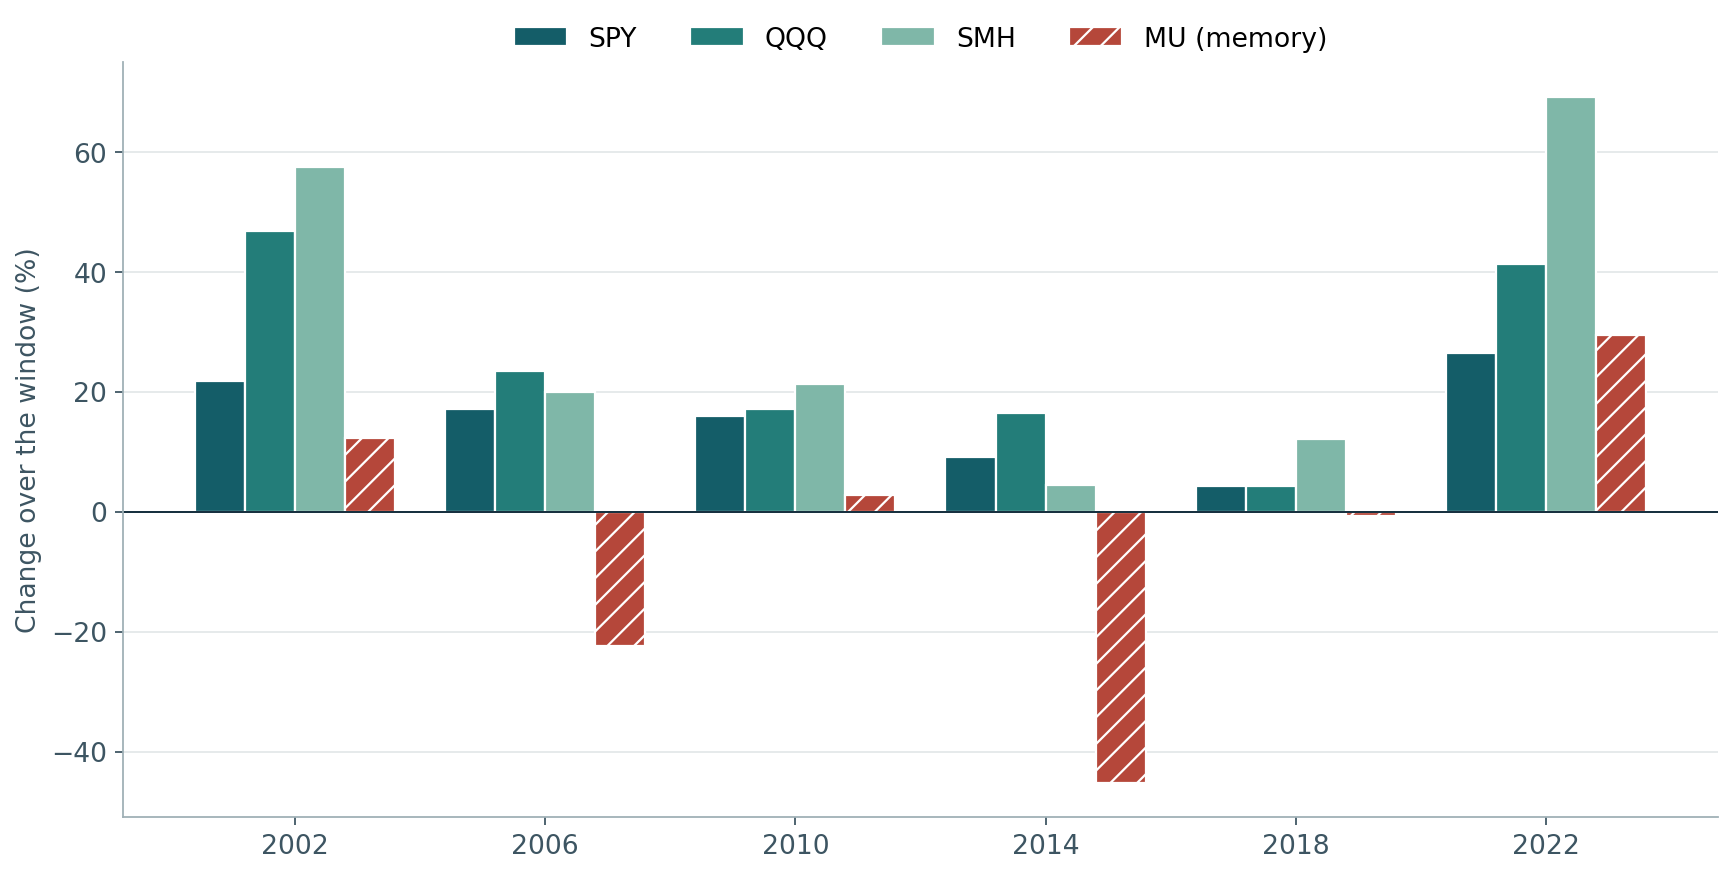
The same window shows up in the funds most investors actually own. Since 2002, SPY, QQQ and the semiconductor fund SMH rose in all six midterm windows.[8]
Since 2002: the index funds went six for six, memory did not
Change from Sep 27 to Jul 18 in each midterm year, percent
View chart data
| Window starting year | SPY | QQQ | SMH | MU |
|---|---|---|---|---|
| 2002 | +21.77% | +46.79% | +57.54% | +12.25% |
| 2006 | +17.11% | +23.53% | +19.92% | -22.39% |
| 2010 | +15.97% | +17.16% | +21.28% | +2.84% |
| 2014 | +9.22% | +16.50% | +4.41% | -45.25% |
| 2018 | +4.36% | +4.26% | +12.11% | -0.71% |
| 2022 | +26.51% | +41.28% | +69.21% | +29.46% |
Nearly a century of history, one failure, during the Great Depression. That is why a one-day AI scare doesn’t shake me right now.
One honest note: winning years still had rough patches. Since 2002, SPY’s worst dip inside the window was about 19% below its starting level before it recovered. The pattern tells you where the road ends, not how smooth it is.[8]
Check this seasonal window yourself. Compare win rates and average results across different histories, and see how far prices moved above or below their starting point. Account access applies in TradeWave.
Why the scare is noise for now
The fundamentals back the pattern: earnings are surging while the market has actually gotten cheaper.
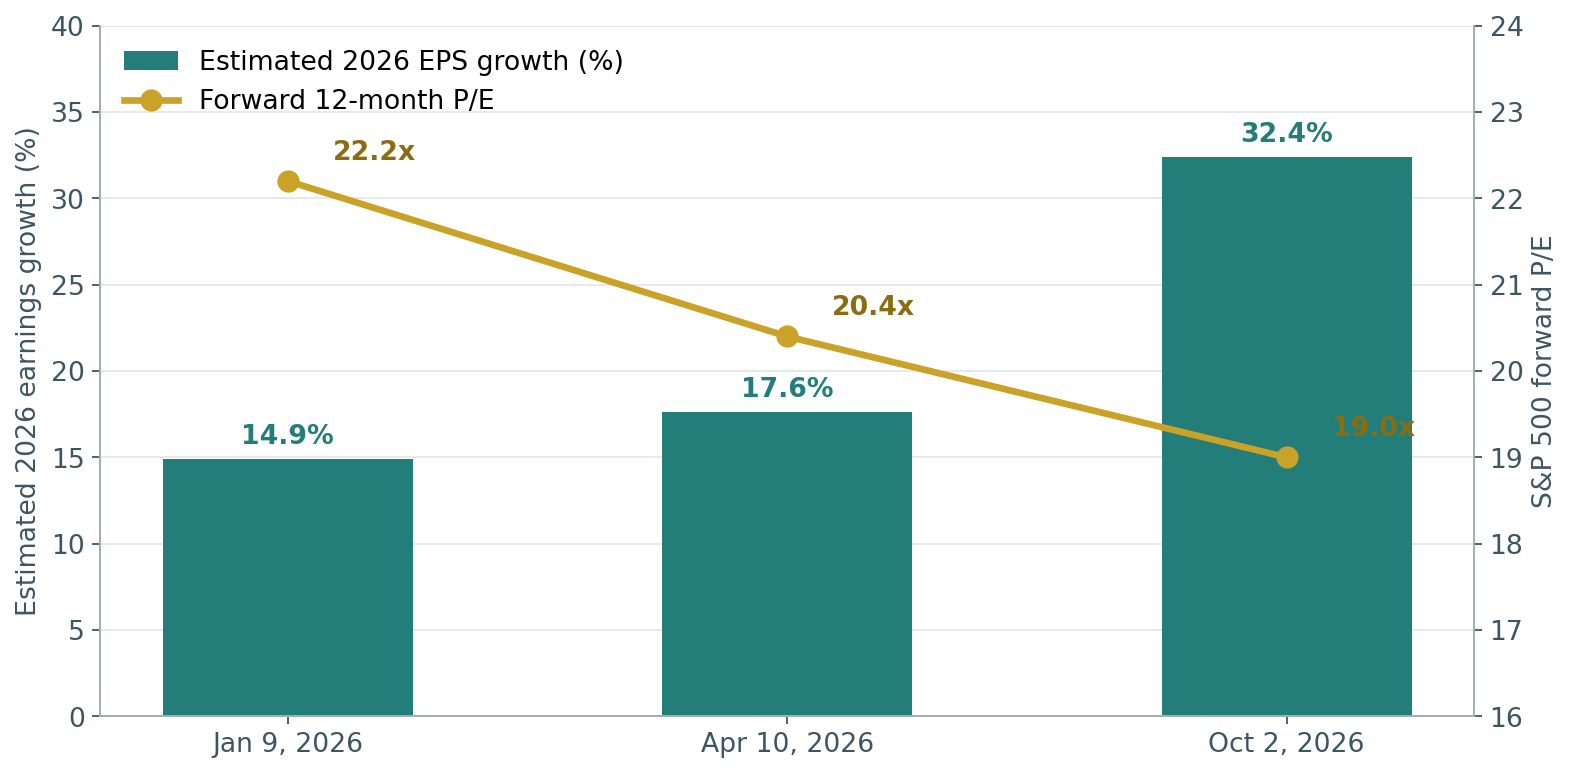
FactSet expects S&P 500 earnings to grow about 29.5% in Q3 2026, the third straight quarter above 25%. Full-year 2026 growth is estimated at 32.4%. Meanwhile the forward P/E fell from 22.2 in January to 19.0 in early October.[4]
Earnings estimates doubled while the market got cheaper
Estimated 2026 S&P 500 earnings growth and forward 12-month P/E, by FactSet report date
View chart data
| Report date | Est. 2026 EPS growth | Forward 12-month P/E |
|---|---|---|
| Jan 9, 2026 | 14.9% | 22.2 |
| Apr 10, 2026 | 17.6% | 20.4 |
| Oct 2, 2026 | 32.4% | 19.0 |
Read that again. Profits up a third, price-to-earnings down. Stocks didn’t run ahead of earnings this year; earnings ran ahead of stocks. That leaves room to rise, which is exactly what the seasonal window predicts.
The exception: memory chips
Not everything rides the window. Micron (MU), the clearest memory-chip play, won only 3 of 6 midterm windows and averaged a 4% loss.[8]
Its worst year, 2014, lost 45%, and at one point it was down 50% inside the window. Memory runs its own boom-and-bust cycle, and the calendar doesn’t override it.
Today everyone says memory is in shortage. Samsung, SK Hynix and Micron reportedly have 2027 supply sold out, with customers getting only 60 to 70% of what they ask for.[6] But shortages are when fabs get built. New capacity from SK Hynix and Samsung is due between February and July 2027.[7] That lines up uncomfortably well with the date the window closes.
Clock #2: AI demand can’t accelerate forever
AI demand is red-hot right now, and the proof is that even the biggest player can’t keep up. OpenAI launched GPT-6, nicknamed Astra, on September 3. A week later it paused new sign-ups for its $200 Pro plan, citing demand that was straining its compute.[2]
When it reopened on September 30, Pro users got roughly half the usage they had before, and a new $500 tier appeared.[3] Before Astra, OpenAI had so much hardware it was resetting top-tier limits two or three times a week. Now it’s rationing. The shortage is real.
Anthropic took the other road. Without OpenAI’s hardware, it competed on efficiency, releasing top models at roughly a quarter of the price. That is the clue to where this goes.
The level of demand isn’t what matters. The slope is. Today’s prices assume spending keeps accelerating. But two things will flatten that slope: saturation, as most people who want AI already have it, and efficiency, as each task needs fewer chips. Total chips can still rise if usage explodes. What drops is chips per task.
Here’s the part most people miss. When spending slows, it won’t be because AI failed. It will be because the technology got better, not just smarter, but cheaper to run.
Not a bubble bursting. An engine shifting gears.
I’m not predicting a crash. I’m saying the one engine pulling this market will shift gears, and not much else is pulling.
Goldman Sachs estimates AI-infrastructure companies account for about half of S&P 500 earnings growth. It projects earnings per share growing 24% in 2026, then slowing to 13% in 2027.[5] With a huge national debt load and plenty of soft signals elsewhere, AI spending is doing the heavy lifting for the whole economy.
So when people say “the AI bubble will burst,” picture something different. Two things happen at once: investment stops accelerating, and efficiency means you need less hardware per task anyway. That’s an industry maturing, not collapsing.
The technology wins. But the stocks priced for endless build-out, chipmakers, memory and power suppliers, get repriced. Even a plateau gets felt everywhere when one engine is carrying this much. That’s when I say watch out.
July 18, 2027: when the tailwind ends
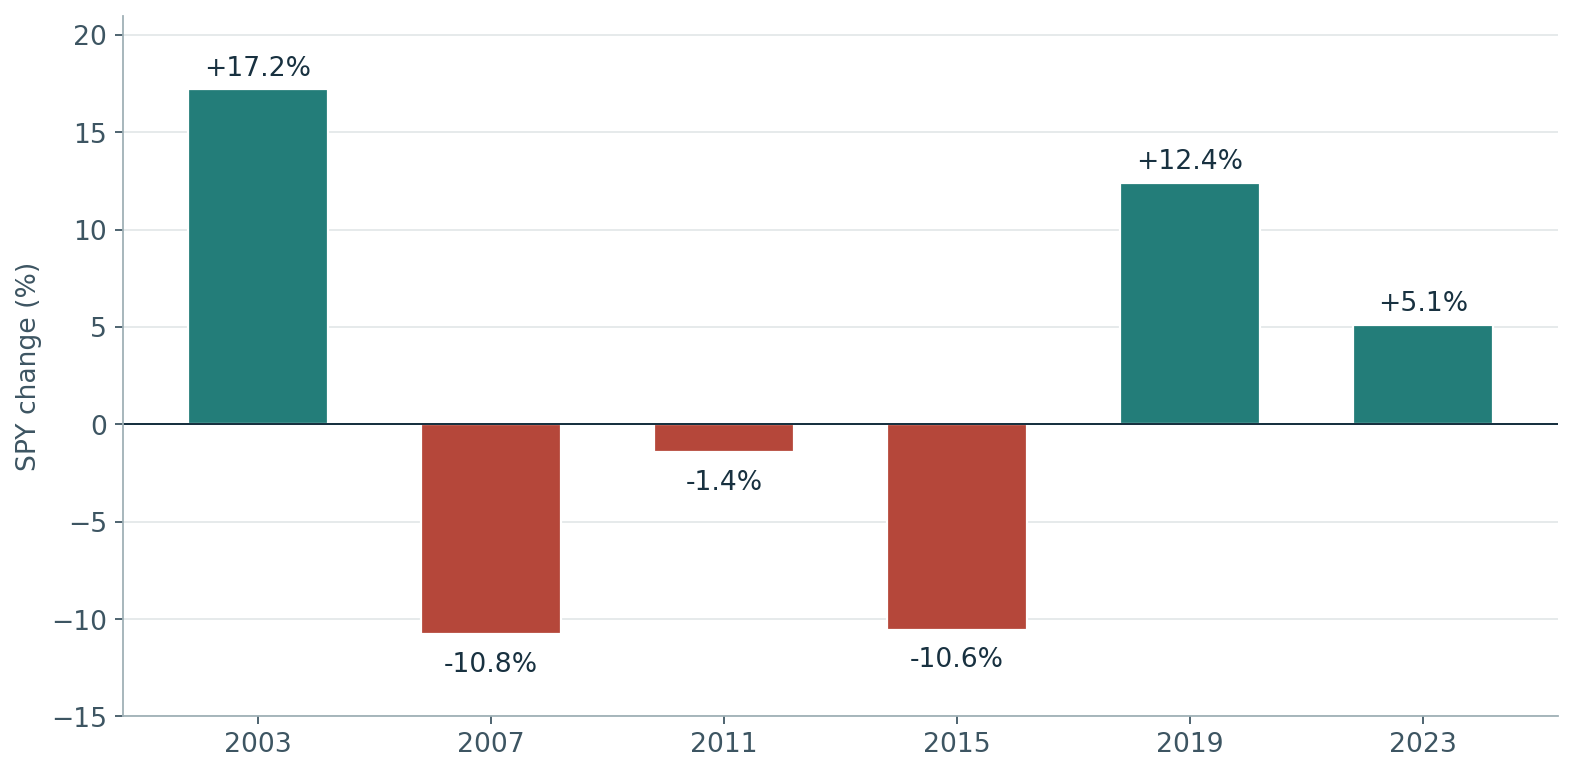
After the window closes, history turns into a coin flip. I ran the same test on the six months after the window, from July 19 into January, for every pre-election year since 2003.[8]
After the window, a coin flip
SPY change from Jul 19 to mid-January in each pre-election year, percent
View chart data
| Window starting year | SPY change |
|---|---|
| 2003 | +17.23% |
| 2007 | -10.78% |
| 2011 | -1.43% |
| 2015 | -10.55% |
| 2019 | +12.42% |
| 2023 | +5.13% |
The S&P won 3 of 6 times and averaged about +2%. The spread was wide: +17% in 2003, but -11% in both 2007 and 2015.
That’s the date both clocks meet. The seasonal tailwind stops, the memory fabs are coming online, and AI spending growth is likely cooling. From that point, the market has to stand on its fundamentals alone. I’m not calling a crash for July 2027. I’m saying the free wind at our backs runs out, and the AI-spending question has to answer for itself.
The light at the end of the tunnel
The data-center phase matures, and then AI gets a body. Robots in warehouses and homes. Self-driving taxis and trucks. Transportation rebuilt around machines that think. All of that is still expanding.
The spending doesn’t stop. It migrates, from training bigger models to putting that intelligence into the physical world. That market touches manufacturing, logistics and labor itself, which makes it far bigger than chatbots.

I think of aviation in the 1940s and 50s. Flight didn’t just create airlines. It created global trade, tourism, air cargo and whole cities built around airports. Nobody could draw that map in advance.
We’ve been here before. Not long ago about 90% of people worked to produce food; today it’s 2 to 4%. Nobody could imagine what everyone else would do, and they built the modern economy. Now a huge share of today’s jobs may be automated. The transition will hurt. But humans will have to rise to a level we can’t fully picture yet. We’ll have to invent it.
What I’m watching, and where I could be wrong
Between now and next summer, three signals will tell me whether the second clock is running early or late.
Where I could be wrong: the plateau date is a judgment call, not data. The window is history; the timing of the slowdown is my read. The handoff to robotics may also leave a gap, because aviation took decades to become an economic engine. And the critics are right that the shortage is real today. My answer is that efficiency is exactly what ends shortages.
Why this one is personal
I run TradeWave as a solo founder, with AI agent teams across three platforms doing the work of a full staff. So I’m watching this shift from the inside.
And I’ll admit something I think about nearly every day: I can’t believe I’m alive to see this technology. Stay long while the pattern says so. Watch the engine. And get ready for what comes next.
— Afshin Moshrefi, founder of TradeWave
About this seasonal analysis
Midterm-election years for the Sep 27 to Jul 18 window: SPX 1930 to 2022 (24), DJI 1954 to 2022 (18), NDX 1986 to 2022 (10), DJT and DJU 1990 to 2022 (9 each), and SPY, QQQ, SMH and MU 2002 to 2022 (6), and 6 pre-election years (2003 to 2023) for the Jul 19 to mid-January period. Dates, years, direction, returns and ranges come from TradeWave. When a window boundary is a weekend or market holiday, TradeWave uses the next available trading session. A year label identifies the start of the historical window; a window can end in the following calendar year.
Historical results are before trading costs and do not guarantee future performance. This article reflects the author’s views and is not investment advice.
AI was used to assist in creating this article and its illustrations. The views and final edits are Afshin Moshrefi’s.
Sources & methodology
- Stock market today: live updates · CNBC · 2026-10-08
- OpenAI puts Pro subscriptions on hold due to Astra demand · TechCrunch · 2026-09-10
- OpenAI to decrease limits on Pro plan from 20 times to 10 times of Plus plan · OfficeChai
- FactSet Earnings Insight · reports of 2026-01-09, 2026-04-10 and 2026-10-02
- S&P 500 forecast to climb as earnings growth powers stocks higher · Goldman Sachs
- Memory chip shortage to last until 2027 as Samsung, SK Hynix and Micron capacity is fully booked · KuCoin News
- SK Hynix warns 2027 could bring the memory industry’s worst supply shortage · Digital Citizen
- TradeWave seasonal evidence: SPX, NDX, DJI, DJT, DJU, SPY, QQQ, SMH and MU · 2026-10-08