
London’s latest silver vault increase raises a practical question for futures investors: how much confidence does today’s physical-market backdrop offer before a historically favorable seasonal window?[1][4]
The November 4–February 2 period finished higher in all seven selected midterm-election years spanning 1998–2022. Yet only 55.0% of the 2006–2025 windows favored the long direction, qualifying that strength before the approaching 2026–2027 window.[4]
London’s dated signals
The LBMA’s September 7 release put end-August silver holdings at 28,431 tonnes, up 0.77% from July.[1]
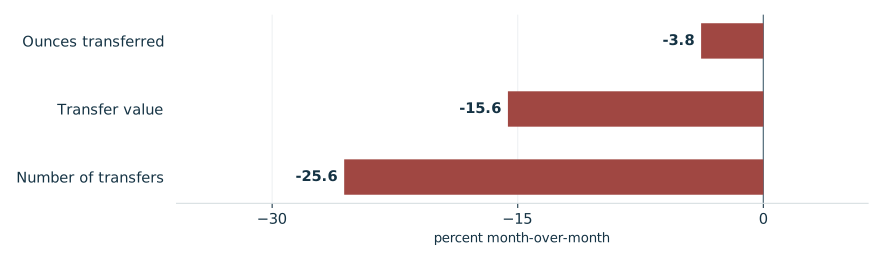
July’s daily average clearing volume, value and transfer count fell, while ounces per transfer rose. These net physical-metal transfers among four London market-maker banks measure a different month and activity from August holdings, not futures demand. The chart compares July with June.[2]
On September 16, the Fed raised its target range a quarter-point to 3.75%–4%, citing elevated inflation. This is policy background, without an established effect on future silver returns.[3]
July London silver clearing fell across three measures
Daily averages; month-over-month changes reported by the LBMA

View chart data & download
| Measure | Value | Period | Status |
|---|---|---|---|
| Ounces transferred | -3.8 | July 2026 | reported |
| Transfer value | -15.6 | July 2026 | reported |
| Number of transfers | -25.6 | July 2026 | reported |
What the midterms show
TradeWave’s selected seasonal record gives a median full-window long result of 8.42% before costs. Seven observations make an interesting timing question, but cannot establish attainable futures profits.[4]
The year-by-year seasonal record

View exact TradeWave observations and download
| Window starting year | Ending price change | Highest from entry | Lowest from entry |
|---|---|---|---|
| 1998 | +10.64% | +10.79% | -7.22% |
| 2002 | +7.76% | +10.32% | -1.83% |
| 2006 | +4.82% | +12.62% | -5.21% |
| 2010 | +8.62% | +20.09% | -4.08% |
| 2014 | +8.14% | +16.00% | -11.27% |
| 2018 | +8.42% | +10.34% | -5.21% |
| 2022 | +13.90% | +19.00% | -1.85% |
Explore this exact seasonal window in TradeWave. Compare its win rate and average result across different histories, and inspect how far prices moved above or below their starting point. Account access applies in TradeWave.
Gains can conceal discomfort
The yearly range chart shows each year’s same seasonal period. November 4, 2014–February 2, 2015 illustrates why endings alone mislead: it gained 8.14% but traded 11.27% below the starting price. The highs and lows reveal neither their order nor a peak-to-trough drawdown.[4]
What happened inside each seasonal window

View exact TradeWave observations and download
| Window starting year | Ending price change | Highest from entry | Lowest from entry |
|---|---|---|---|
| 1998 | +10.64% | +10.79% | -7.22% |
| 2002 | +7.76% | +10.32% | -1.83% |
| 2006 | +4.82% | +12.62% | -5.21% |
| 2010 | +8.62% | +20.09% | -4.08% |
| 2014 | +8.14% | +16.00% | -11.27% |
| 2018 | +8.42% | +10.34% | -5.21% |
| 2022 | +13.90% | +19.00% | -1.85% |
Checking across all years
Broader checks test whether midterm strength carries across all years. The 2006–2025 long median was 1.2%, versus the selected midterms’ 8.42%. The 2016–2025 study selected short: its positive 1.32% median means falling prices favored that direction, but its all-window average was -7.76%. Both comparisons reuse selected midterms; the recent decade also sits inside the longer history. Their differences weaken confidence, without proving an election effect or providing independent confirmation.[4]
See the history behind this comparison
TradeWave checks the same seasonal dates across different sets of years. This helps show whether the pattern holds up when you look at another stretch of history.
| History | Observed start years | Direction | Success rate | Median result |
|---|---|---|---|---|
| Article study: 7 selected midterm-election years (1998–2022) | 1998, 2002, 2006, 2010, 2014, 2018, 2022 | long | 100.0% | 8.42% |
| 10 consecutive historical windows (2016–2025) | 2016, 2017, 2018, 2019, 2020, 2021, 2022, 2023, 2024, 2025 | short | 60.0% | 1.32% |
| 20 consecutive historical windows (2006–2025) | 2006, 2007, 2008, 2009, 2010, 2011, 2012, 2013, 2014, 2015, 2016, 2017, 2018, 2019, 2020, 2021, 2022, 2023, 2024, 2025 | long | 55.0% | 1.2% |
Some years appear in more than one group, so agreement is not an independent test. A requested lookback can extend beyond available history; the observed years are listed above. Election-cycle groups use matching phases, not consecutive years. Results follow the direction shown: a positive short result means prices fell. Small samples and different market periods make the comparison less conclusive.
Before November 4
Before November 4, inspect this window’s outcomes across histories in TradeWave. Recorded prices end October 2, so they cannot establish future entry conditions. The illustration below uses this article’s seven selected midterm years, superimposing a section of TradeWave’s seasonal trend scaled to the last recorded price for the next 60 weekdays, October 5–December 25. That separate horizon illustrates historical shape, not a price target or forecast for the full window ending February 2, 2027.[4]
Price history and the seasonal outlook

Explore this exact seasonal window in TradeWave. Compare its win rate and average result across different histories, and inspect how far prices moved above or below their starting point. Account access applies in TradeWave.
About this seasonal analysis
7 selected midterm-election years (1998–2022). The selected dates, years, direction, returns and ranges come from TradeWave. When a window boundary is a weekend or market holiday, TradeWave uses the next available trading session. SMN displays the returned results without recalculating them. A year label identifies the start of the historical window; a window can end in the following calendar year.
Green and red bars show the underlying adjusted-price movement. The range endpoints measure changes from the entry price, not a peak-to-trough loss. Historical results are before trading costs and do not guarantee future performance.
Sources & methodology
- London Gold and Silver Vault Data for August 2026 · 2026-09-07
- LBMA Net Clearing Data (Daily Averages): July 2026 · 2026-09-01
- Federal Reserve issues FOMC statement · 2026-09-16
- TradeWave SI seasonal evidence · 2026-10-05