
For IWM investors, September’s rate increase raises the stakes of deciding how much weight to give autumn history. Today’s conditions cannot establish those at the ETF’s future window entry.[3][5]
The October 24–December 2 window finished higher in all six selected midterm-election years from 2002–2022. Broader histories include losses, however. How much reassurance should that favorable but limited seasonal record provide?[5]
Rates, jobs and Russell’s calendar
FTSE Russell’s July 20 review reported broad small-cap outperformance in the second quarter, while warning of potentially higher rates and volatility.[1]
On September 16, the Fed raised its target range a quarter point to 3.75%–4%, citing elevated inflation. It also described resilient domestic spending and robust capital investment.[3]
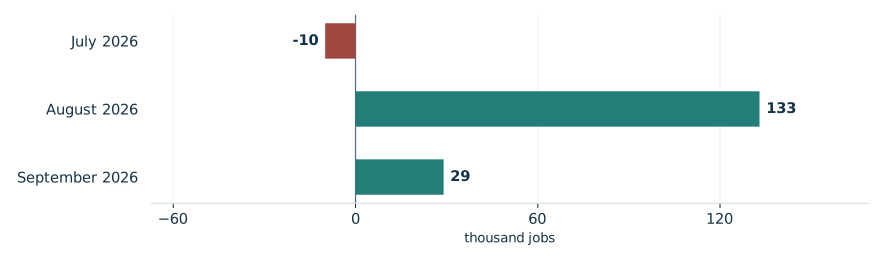
BLS’s October 2 release reported September payroll growth of 29,000 against a prior-12-month monthly average of 45,000, with unemployment at 4.2%. July and August revisions removed a combined 60,000 jobs from earlier estimates. The next release is November 6.[4]
Reported monthly U.S. payroll changes
July and August figures reflect revisions published October 2, 2026

View chart data & download
| Measure | Value | Period | Status |
|---|---|---|---|
| July 2026 | -10 | July 2026 | reported |
| August 2026 | 133 | August 2026 | reported |
| September 2026 | 29 | September 2026 | reported |
A favorable selected record
TradeWave’s selected study reports a 6.86% average full-window long result before costs. Six observations give investors a reason to investigate these dates, but little basis for certainty.[5]
The year-by-year seasonal record

View exact TradeWave observations and download
| Window starting year | Ending price change | Highest from entry | Lowest from entry |
|---|---|---|---|
| 2002 | +11.78% | +13.60% | -0.92% |
| 2006 | +4.51% | +4.52% | -2.37% |
| 2010 | +6.21% | +6.43% | -2.02% |
| 2014 | +4.66% | +6.94% | -1.40% |
| 2018 | +5.57% | +8.19% | -0.86% |
| 2022 | +8.42% | +9.29% | +0.00% |
Explore this exact seasonal window in TradeWave. Compare its win rate and average result across different histories, and inspect how far prices moved above or below their starting point. Account access applies in TradeWave.
What a winning finish conceals
The yearly range chart covers the same seasonal period each year, not whole calendar years. October 24–December 2, 2006 illustrates the difference between finishing higher and enduring losses: IWM gained 4.51% but traded 2.37% below the starting price. The highs and lows establish neither their order nor peak-to-trough drawdown.[5]
What happened inside each seasonal window

View exact TradeWave observations and download
| Window starting year | Ending price change | Highest from entry | Lowest from entry |
|---|---|---|---|
| 2002 | +11.78% | +13.60% | -0.92% |
| 2006 | +4.51% | +4.52% | -2.37% |
| 2010 | +6.21% | +6.43% | -2.02% |
| 2014 | +4.66% | +6.94% | -1.40% |
| 2018 | +5.57% | +8.19% | -0.86% |
| 2022 | +8.42% | +9.29% | +0.00% |
Looking across all years
The broader histories check whether the favorable reading extends across all years. Both include losses; the median falls from 6.51% for 2016–2025 to 3.49% for 2006–2025, making the gain less convincing further back. Each reuses selected midterm observations, and the shorter history sits entirely within the longer. Their agreement is not independent confirmation or proof of an election effect.[5]
See the history behind this comparison
TradeWave checks the same seasonal dates across different sets of years. This helps show whether the pattern holds up when you look at another stretch of history.
| History | Observed start years | Direction | Success rate | Median result |
|---|---|---|---|---|
| Article study: 6 selected midterm-election years (2002–2022) | 2002, 2006, 2010, 2014, 2018, 2022 | long | 100.0% | 5.89% |
| 10 consecutive historical windows (2016–2025) | 2016, 2017, 2018, 2019, 2020, 2021, 2022, 2023, 2024, 2025 | long | 80.0% | 6.51% |
| 20 consecutive historical windows (2006–2025) | 2006, 2007, 2008, 2009, 2010, 2011, 2012, 2013, 2014, 2015, 2016, 2017, 2018, 2019, 2020, 2021, 2022, 2023, 2024, 2025 | long | 80.0% | 3.49% |
Some years appear in more than one group, so agreement is not an independent test. A requested lookback can extend beyond available history; the observed years are listed above. Election-cycle groups use matching phases, not consecutive years. Results follow the direction shown: a positive short result means prices fell. Small samples and different market periods make the comparison less conclusive.
The checkpoints ahead
Russell’s October 30 rank day determines index eligibility inputs; preliminary changes follow November 13. Implementation comes after market close December 11, beyond the window. These index milestones do not establish future IWM returns.[2]
The price chart below ends recorded prices on October 6. Its rescaled average seasonal path uses this article’s six selected midterm years over the next 60 weekdays, October 7–December 29, separately from the full study window. It illustrates historical shape, not a forecast or price target. Ahead of entry, inspect this same window’s differing histories and range of outcomes in TradeWave.[5]
Price history and the seasonal outlook

Explore this exact seasonal window in TradeWave. Compare its win rate and average result across different histories, and inspect how far prices moved above or below their starting point. Account access applies in TradeWave.
About this seasonal analysis
6 selected midterm-election years (2002–2022). The selected dates, years, direction, returns and ranges come from TradeWave. When a window boundary is a weekend or market holiday, TradeWave uses the next available trading session. SMN displays the returned results without recalculating them. A year label identifies the start of the historical window; a window can end in the following calendar year.
Green and red bars show the underlying adjusted-price movement. The range endpoints measure changes from the entry price, not a peak-to-trough loss. Historical results are before trading costs and do not guarantee future performance.
Sources & methodology
- Russell US Indexes Spotlight - July 2026 · 2026-07-20
- FTSE Russell announces December 2026 Russell US Indexes Reconstitution schedule · 2026-09-01
- Federal Reserve issues FOMC statement · 2026-09-16
- Employment Situation News Release · 2026-10-02
- TradeWave IWM seasonal evidence · 2026-10-07