
Will ample supply keep winter heating demand from lifting natural gas futures? EIA’s October 6 outlook anticipates above-average storage when heating begins.[1]
The October 10–November 24, 2026 seasonal window approaches with gains in all eight selected midterm years. Yet only half the 2016–2025 windows rose, weakening the case for a dependable autumn advance.[5]
Supply meets winter demand
EIA’s September 25 report put June–August 2026 Henry Hub spot gas at $2.93/MMBtu, 6% below summer 2025 despite exceptional heat. Renewable generation, record production and ample inventories limited price pressure; LNG terminal maintenance moderated demand growth.[3]
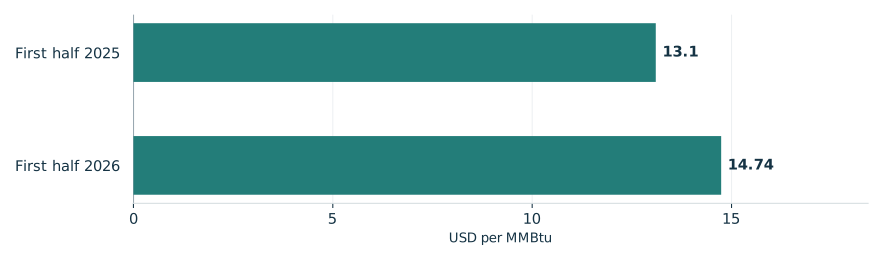
Its September 1 report nevertheless showed first-half 2026 LNG exports up 23% to 17.4 Bcf/d. The European benchmark chart provides export-demand context.[4]
October’s outlook forecasts October 31 storage of 3,850 Bcf, 2% above the five-year average for the November 1 heating-season start. It assumes nearly unchanged winter heating degree days; prolonged cold could increase withdrawals. Its 2027 Henry Hub spot forecast is $3.16/MMBtu versus $3.48 projected for 2026, down 9%, largely reflecting January 2026’s storm-related price spike.[1]
European LNG benchmark prices rose in the first half of 2026
Reported Title Transfer Facility average prices

View chart data & download
| Measure | Value | Period | Status |
|---|---|---|---|
| First half 2025 | 13.1 | 1H25 | reported |
| First half 2026 | 14.74 | 1H26 | reported |
The selected midterm record
TradeWave’s eight selected midterm-election years spanning 1994–2022 show a 12.08% median full-window long result. That favorable seasonal record concerns futures timing; today’s fundamentals cannot validate its repetition.[5]
The year-by-year seasonal record

View exact TradeWave observations and download
| Window starting year | Ending price change | Highest from entry | Lowest from entry |
|---|---|---|---|
| 1994 | +12.85% | +23.04% | -6.51% |
| 1998 | +2.87% | +26.38% | -6.65% |
| 2002 | +11.31% | +15.99% | -2.30% |
| 2006 | +23.69% | +27.75% | -13.66% |
| 2010 | +18.49% | +21.69% | -10.80% |
| 2014 | +7.57% | +17.75% | -8.24% |
| 2018 | +29.02% | +48.98% | -5.97% |
| 2022 | +5.79% | +20.53% | -21.21% |
Explore this exact seasonal window in TradeWave. Compare its win rate and average result across different histories, and inspect how far prices moved above or below their starting point. Account access applies in TradeWave.
A gain can conceal losses
The yearly range chart covers the same seasonal period each year, not entire calendar years. The latest selected example, October 10–November 24, 2022, illustrates the stakes: a 5.79% ending gain accompanied a low 21.21% below the starting price. Those highs and lows reveal neither their order nor peak-to-trough drawdown.[5]
EIA forecasts lower national gas-heating expenditures this winter, but a slight increase in the colder West. Weather remains a regional qualification.[2]
What happened inside each seasonal window

View exact TradeWave observations and download
| Window starting year | Ending price change | Highest from entry | Lowest from entry |
|---|---|---|---|
| 1994 | +12.85% | +23.04% | -6.51% |
| 1998 | +2.87% | +26.38% | -6.65% |
| 2002 | +11.31% | +15.99% | -2.30% |
| 2006 | +23.69% | +27.75% | -13.66% |
| 2010 | +18.49% | +21.69% | -10.80% |
| 2014 | +7.57% | +17.75% | -8.24% |
| 2018 | +29.02% | +48.98% | -5.97% |
| 2022 | +5.79% | +20.53% | -21.21% |
Across all years
Broader histories test whether the midterm result travels: success falls from 65.0% across 2006–2025 to 50.0% across 2016–2025. The smaller midterm sample warrants caution, not an election explanation. Those comparisons reuse five and two selected midterm years respectively; all ten recent windows also appear in the longer history, limiting independent confirmation.[5]
See the history behind this comparison
TradeWave checks the same seasonal dates across different sets of years. This helps show whether the pattern holds up when you look at another stretch of history.
| History | Observed start years | Direction | Success rate | Median result |
|---|---|---|---|---|
| Article study: 8 selected midterm-election years (1994–2022) | 1994, 1998, 2002, 2006, 2010, 2014, 2018, 2022 | long | 100.0% | 12.08% |
| 10 consecutive historical windows (2016–2025) | 2016, 2017, 2018, 2019, 2020, 2021, 2022, 2023, 2024, 2025 | long | 50.0% | 0.37% |
| 20 consecutive historical windows (2006–2025) | 2006, 2007, 2008, 2009, 2010, 2011, 2012, 2013, 2014, 2015, 2016, 2017, 2018, 2019, 2020, 2021, 2022, 2023, 2024, 2025 | long | 65.0% | 5.6% |
Some years appear in more than one group, so agreement is not an independent test. A requested lookback can extend beyond available history; the observed years are listed above. Election-cycle groups use matching phases, not consecutive years. Results follow the direction shown: a positive short result means prices fell. Small samples and different market periods make the comparison less conclusive.
What to inspect next
Recorded prices end October 7, 2026, before entry; no current futures quote is supplied. Below, this study’s eight selected years supply a normalized average seasonal path over the next 60 weekdays, October 8–December 30. That separate horizon illustrates historical shape, not a price target.[5]
EIA’s November 10 outlook can revisit the storage cushion. Its conditional spot forecasts do not establish attainable futures returns.[1]
In TradeWave, compare this same window across histories and inspect the range of outcomes.[5]
Price history and the seasonal outlook

Explore this exact seasonal window in TradeWave. Compare its win rate and average result across different histories, and inspect how far prices moved above or below their starting point. Account access applies in TradeWave.
About this seasonal analysis
8 selected midterm-election years (1994–2022). The selected dates, years, direction, returns and ranges come from TradeWave. When a window boundary is a weekend or market holiday, TradeWave uses the next available trading session. SMN displays the returned results without recalculating them. A year label identifies the start of the historical window; a window can end in the following calendar year.
Green and red bars show the underlying adjusted-price movement. The range endpoints measure changes from the entry price, not a peak-to-trough loss. Historical results are before trading costs and do not guarantee future performance.
Sources & methodology
- Natural gas · 2026-10-06
- Winter Fuels Outlook 2026–27 · 2026-10-06
- Henry Hub natural gas prices this summer were 6% lower than last summer · 2026-09-25
- U.S. LNG exports rose 23% in the first half of 2026 because of higher capacity · 2026-09-01
- TradeWave NG seasonal evidence · 2026-10-08