
For investors in Omnicom common stock (NYSE: OMC), the question is whether the IPG combination can deliver lasting profit gains. With IPG included in its accounts since November 2025, the approaching October window brings that business question alongside a distinctive seasonal record.[2][5]
The October 13–November 15 period gained in all 10 selected midterm years spanning 1986–2022, although the consecutive 2016–2025 and 2006–2025 histories were weaker. As of October 8, the 2026 window has yet to begin.[5]
What integration has delivered
The June 2026 quarter produced $6.6 billion consolidated revenue and $2.08 GAAP diluted EPS. IPG entered the accounts in November 2025, limiting historical comparability.[2]
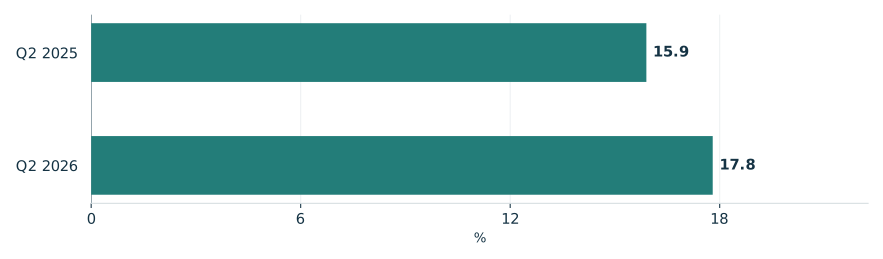
Released July 28, those results showed $6.0 billion core revenue, with 6.1% organic growth plus a currency benefit. Core figures exclude dispositions and held-for-sale businesses; the 2025 base combines Omnicom and IPG. Core adjusted EBITA margin reached 17.8% versus 15.9% in June 2025, chiefly through cost reduction synergies. Consolidated revenue growth chiefly reflected the acquisition and constant-currency growth. Integration costs partly offset operating-income gains from growth and IPG.[1]
The August 28 Hearts United agency combination and September 9 appointment of Andrew Robertson as advertising CEO document organizational changes, without establishing October financial performance.[3][4]
Core adjusted EBITA margin improved
Second-quarter margins; 2025 on a combined Omnicom–IPG basis

View chart data & download
| Measure | Value | Period | Status |
|---|---|---|---|
| Q2 2025 | 15.9 | Q2 2025 | reported |
| Q2 2026 | 17.8 | Q2 2026 | reported |
A favorable midterm record
TradeWave’s selected seasonal record shows a 10.88% median full-window gain. These are ten separate midterm years, not consecutive observations. The record gives investors a reason to examine this approaching period, while the broader comparisons limit confidence in a repeat. Share-price history cannot establish whether integration will succeed.[5]
The year-by-year seasonal record

View exact TradeWave observations and download
| Window starting year | Ending price change | Highest from entry | Lowest from entry |
|---|---|---|---|
| 1986 | +8.01% | +10.01% | -10.00% |
| 1990 | +2.47% | +3.70% | -20.37% |
| 1994 | +5.21% | +6.70% | -0.74% |
| 1998 | +25.71% | +27.52% | -0.30% |
| 2002 | +15.12% | +15.41% | -2.10% |
| 2006 | +7.84% | +8.51% | -0.69% |
| 2010 | +11.40% | +15.33% | -0.73% |
| 2014 | +14.43% | +14.75% | -1.39% |
| 2018 | +10.37% | +12.01% | +0.00% |
| 2022 | +13.45% | +14.87% | -2.18% |
Explore this exact seasonal window in TradeWave. Compare its win rate and average result across different histories, and inspect how far prices moved above or below their starting point. Account access applies in TradeWave.
Positive endings can conceal losses
The yearly range chart covers the same seasonal period each year, not whole calendar years. October 13–November 15, 1990 is useful because a 2.47% ending gain coexisted with a move 20.37% below the starting price. That distinction matters to anyone assessing what holding through the window could involve. The highs and lows reveal neither their order nor a peak-to-trough loss.[5]
What happened inside each seasonal window

View exact TradeWave observations and download
| Window starting year | Ending price change | Highest from entry | Lowest from entry |
|---|---|---|---|
| 1986 | +8.01% | +10.01% | -10.00% |
| 1990 | +2.47% | +3.70% | -20.37% |
| 1994 | +5.21% | +6.70% | -0.74% |
| 1998 | +25.71% | +27.52% | -0.30% |
| 2002 | +15.12% | +15.41% | -2.10% |
| 2006 | +7.84% | +8.51% | -0.69% |
| 2010 | +11.40% | +15.33% | -0.73% |
| 2014 | +14.43% | +14.75% | -1.39% |
| 2018 | +10.37% | +12.01% | +0.00% |
| 2022 | +13.45% | +14.87% | -2.18% |
Consecutive histories are weaker
Checking consecutive years tests how broadly the finding holds: 60.0% of windows were profitable in 2016–2025, versus 65.0% in 2006–2025. Both temper the perfect selected record; ten midterm observations across different eras cannot establish an election effect. The comparisons reuse two and five selected midterm years, respectively, and the shorter history sits entirely within the longer one, limiting independent confirmation.[5]
See the history behind this comparison
TradeWave checks the same seasonal dates across different sets of years. This helps show whether the pattern holds up when you look at another stretch of history.
| History | Observed start years | Direction | Success rate | Median result |
|---|---|---|---|---|
| Article study: 10 selected midterm-election years (1986–2022) | 1986, 1990, 1994, 1998, 2002, 2006, 2010, 2014, 2018, 2022 | long | 100.0% | 10.88% |
| 10 consecutive historical windows (2016–2025) | 2016, 2017, 2018, 2019, 2020, 2021, 2022, 2023, 2024, 2025 | long | 60.0% | 3.55% |
| 20 consecutive historical windows (2006–2025) | 2006, 2007, 2008, 2009, 2010, 2011, 2012, 2013, 2014, 2015, 2016, 2017, 2018, 2019, 2020, 2021, 2022, 2023, 2024, 2025 | long | 65.0% | 3.88% |
Some years appear in more than one group, so agreement is not an independent test. A requested lookback can extend beyond available history; the observed years are listed above. Election-cycle groups use matching phases, not consecutive years. Results follow the direction shown: a positive short result means prices fell. Small samples and different market periods make the comparison less conclusive.
Before the window opens
The price chart below overlays the selected midterm years’ normalized seasonal trend, rescaled to illustrate its shape, on the price chart. Recorded prices end October 7, 2026. The next 60 weekdays, October 8–December 30, belong only to the seasonal illustration, a separate horizon extending beyond the full seasonal window. It is neither an earnings prediction nor a price target.[5]
Next, confirm earnings timing: TradeWave estimates October 27, without saved company confirmation. In TradeWave, compare this same window across the supplied histories and inspect the yearly ranges to judge how much encouragement the selected midterm record deserves.[5]
Price history and the seasonal outlook

Explore this exact seasonal window in TradeWave. Compare its win rate and average result across different histories, and inspect how far prices moved above or below their starting point. Account access applies in TradeWave.
About this seasonal analysis
10 selected midterm-election years (1986–2022). The selected dates, years, direction, returns and ranges come from TradeWave. When a window boundary is a weekend or market holiday, TradeWave uses the next available trading session. SMN displays the returned results without recalculating them. A year label identifies the start of the historical window; a window can end in the following calendar year.
Green and red bars show the underlying adjusted-price movement. The range endpoints measure changes from the entry price, not a peak-to-trough loss. Historical results are before trading costs and do not guarantee future performance.
Sources & methodology
- Omnicom Reports Second Quarter 2026 Results · 2026-07-28
- Omnicom Group Inc. Quarterly Report on Form 10-Q for the Quarter Ended June 30, 2026 · 2026-07-29
- Omnicom Media Officially Launches Hearts United · 2026-08-28
- Omnicom Advertising Announces Leadership Transition · 2026-09-09
- TradeWave OMC seasonal evidence · 2026-10-08