
Investors weighing protection against stock-market swings face a timely question: does the VIX’s October 2 decline after September’s soft jobs report offer reassurance as its autumn seasonal window approaches?[1][5]
The October 10–February 15 window ended lower in all eight selected midterm-election years spanning 1994–2022, although broader histories include increases. That favorable seasonal record cannot establish the starting level on October 10, 2026, or guarantee calm through February 15, 2027.[5]
What the jobs release established
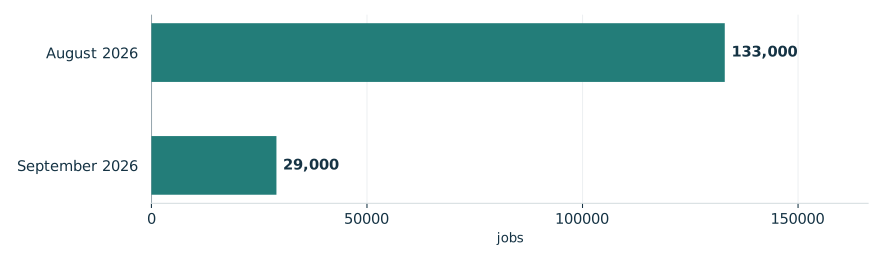
BLS reported 29,000 September payroll additions versus August’s revised 133,000, with unemployment at 4.2%. July and August revisions removed a combined 60,000 jobs.[2]
In its October 2 commentary, Cboe reported that VIX fell 5.25% to 15.53 as stocks rose and Treasury yields fell after the jobs release. Its suggestion that weaker hiring might ease pressure for an October rate hike was commentary, not a Fed decision or an October 8 forecast.[1]
U.S. payroll gains slowed in September
Reported monthly change in total nonfarm employment

View chart data & download
| Measure | Value | Period | Status |
|---|---|---|---|
| August 2026 | 133,000 | August 2026 | reported |
| September 2026 | 29,000 | September 2026 | reported |
Consistent endings in selected midterms
TradeWave’s selected seasonal record favors a declining index level. Its positive short-direction statistics describe falling spot VIX, which cannot be bought or shorted directly; they are not attainable futures, options or exchange-traded-product profits. The record chart shows actual index changes across complete windows.[5]
The year-by-year seasonal record

View exact TradeWave observations and download
| Window starting year | Ending price change | Highest from entry | Lowest from entry |
|---|---|---|---|
| 1994 | -21.74% | +32.95% | -28.60% |
| 1998 | -26.00% | +3.82% | -49.89% |
| 2002 | -17.15% | +0.00% | -38.62% |
| 2006 | -11.28% | +11.37% | -18.49% |
| 2010 | -13.66% | +25.74% | -21.62% |
| 2014 | -25.61% | +46.23% | -45.72% |
| 2018 | -35.06% | +57.67% | -35.58% |
| 2022 | -43.82% | +6.41% | -47.43% |
Explore this exact seasonal window in TradeWave. Compare its win rate and average result across different histories, and inspect how far prices moved above or below their starting point. Account access applies in TradeWave.
Lower endings can conceal sharp rises
The yearly range chart covers the same seasonal period each year, not whole calendar years. October 10, 2018–February 15, 2019 is especially instructive because it contains the largest rise above the starting level among the eight selected windows: 57.67%. VIX nevertheless ended that period down 35.06%. These highs and lows reveal movement hidden by the ending result, without establishing their order or a peak-to-trough drawdown. They do not set a limit on future moves.[5]
What happened inside each seasonal window

View exact TradeWave observations and download
| Window starting year | Ending price change | Highest from entry | Lowest from entry |
|---|---|---|---|
| 1994 | -21.74% | +32.95% | -28.60% |
| 1998 | -26.00% | +3.82% | -49.89% |
| 2002 | -17.15% | +0.00% | -38.62% |
| 2006 | -11.28% | +11.37% | -18.49% |
| 2010 | -13.66% | +25.74% | -21.62% |
| 2014 | -25.61% | +46.23% | -45.72% |
| 2018 | -35.06% | +57.67% | -35.58% |
| 2022 | -43.82% | +6.41% | -47.43% |
Broader histories weaken the certainty
Checking across all years tests whether the result extends beyond selected midterms: both 2016–2025 and 2006–2025 recorded declines in 80.0% of windows, supporting the direction with less consistency. The eight-window selection is small, and agreement offers limited independent confirmation: the shorter comparison reuses 2018 and 2022; the longer reuses 2006, 2010, 2014, 2018 and 2022, and includes the entire shorter history.[5]
See the history behind this comparison
TradeWave checks the same seasonal dates across different sets of years. This helps show whether the pattern holds up when you look at another stretch of history.
| History | Observed start years | Direction | Success rate | Median result |
|---|---|---|---|---|
| Article study: 8 selected midterm-election years (1994–2022) | 1994, 1998, 2002, 2006, 2010, 2014, 2018, 2022 | short | 100.0% | 23.67% |
| 10 consecutive historical windows (2016–2025) | 2016, 2017, 2018, 2019, 2020, 2021, 2022, 2023, 2024, 2025 | short | 80.0% | 15.0% |
| 20 consecutive historical windows (2006–2025) | 2006, 2007, 2008, 2009, 2010, 2011, 2012, 2013, 2014, 2015, 2016, 2017, 2018, 2019, 2020, 2021, 2022, 2023, 2024, 2025 | short | 80.0% | 15.0% |
Some years appear in more than one group, so agreement is not an independent test. A requested lookback can extend beyond available history; the observed years are listed above. Election-cycle groups use matching phases, not consecutive years. Results follow the direction shown: a positive short result means prices fell. Small samples and different market periods make the comparison less conclusive.
Watch hiring, inspect the historical range
The next employment report, scheduled for November 6, 2026, will update the hiring picture.[2]
In TradeWave, inspect how widely this same window’s outcomes varied. The following illustration overlays the selected eight midterm years’ average seasonal path, rescaled for comparison, on recorded VIX levels ending October 7, 2026. Its next 60 weekdays run October 8–December 30, 2026, a separate horizon from the full seasonal window. Those future dates show historical shape, not recorded levels, a prediction or a target.[5]
Price history and the seasonal outlook

Explore this exact seasonal window in TradeWave. Compare its win rate and average result across different histories, and inspect how far prices moved above or below their starting point. Account access applies in TradeWave.
About this seasonal analysis
8 selected midterm-election years (1994–2022). The selected dates, years, direction, returns and ranges come from TradeWave. When a window boundary is a weekend or market holiday, TradeWave uses the next available trading session. SMN displays the returned results without recalculating them. A year label identifies the start of the historical window; a window can end in the following calendar year.
Green and red bars show the underlying adjusted-price movement. The range endpoints measure changes from the entry price, not a peak-to-trough loss. Historical results are before trading costs and do not guarantee future performance.
Sources & methodology
- Market Gains Momentum after Soft Jobs Report · 2026-10-02
- Employment Situation News Release - 2026 M09 Results · 2026-10-02
- Week of 9/28/2026: Equities Unfazed by Spike in Rates Volatility · 2026-09-28
- Week of 9/14/2026: Macro Uncertainty Fuels Hedging Demand Ahead of FOMC · 2026-09-14
- TradeWave VIX seasonal evidence · 2026-10-08