
Walmart shareholders have a concrete holiday question: can easier shopping strengthen the business? On October 7, Express Pickup was available at 500 stores, with Walmart promising nationwide expansion in the coming weeks, in time for Thanksgiving meal shopping.[1]
The approaching October 12–November 13 seasonal window finished higher in all ten selected years, 2016–2025. That favorable timing deserves attention, although the longer 2006–2025 record includes four losses. How much weight should investors give the recent consistency?[4]
The business baseline
Walmart’s August 28 filing identifies WMT as its common stock. For the quarter ended July 31, 2026, operating income was $9,383 million versus $7,286 million a year earlier. Historically, its highest sales volume occurs in the quarter ending January 31.[3]
Walmart’s August 20 report described global eCommerce growth as “Driven by strong demand for convenient, fast delivery.” Roughly 17% adjusted operating income growth in constant currency included a 750-basis-point net tariff-refund benefit; excluding it, underlying growth reached the top of 7–10% guidance. Walmart U.S. comparable sales were steady with prior periods excluding a negative 125-basis-point impact from Maximum Fair Pricing pharmacy legislation.[2]
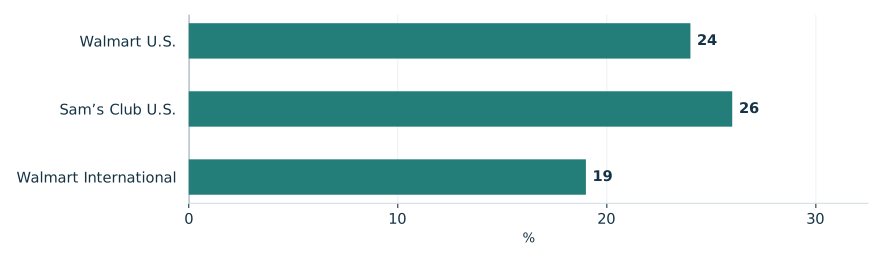
Reported eCommerce growth across Walmart’s businesses
Fiscal second quarter 2027

View chart data & download
| Measure | Value | Period | Status |
|---|---|---|---|
| Walmart U.S. | 24 | Q2 FY27 | reported |
| Sam’s Club U.S. | 26 | Q2 FY27 | reported |
| Walmart International | 19 | Q2 FY27 | reported |
A favorable recent record
TradeWave’s selected seasonal record averaged 4.79% across complete windows before trading costs. This describes historical share performance; Walmart’s holiday sales seasonality cannot establish a future stock return. The record helps frame the timing question without answering whether the business will deliver stronger results.[4][3]
The year-by-year seasonal record

View exact TradeWave observations and download
| Window starting year | Ending price change | Highest from entry | Lowest from entry |
|---|---|---|---|
| 2016 | +4.49% | +6.86% | -0.58% |
| 2017 | +5.68% | +6.83% | -1.25% |
| 2018 | +8.58% | +12.02% | -1.04% |
| 2019 | +1.52% | +1.84% | -1.96% |
| 2020 | +4.36% | +4.64% | -4.77% |
| 2021 | +5.40% | +9.05% | -0.90% |
| 2022 | +5.50% | +9.83% | -2.13% |
| 2023 | +5.49% | +5.61% | -0.59% |
| 2024 | +6.49% | +6.85% | +0.00% |
| 2025 | +0.41% | +7.31% | -2.05% |
Explore this exact seasonal window in TradeWave. Compare its win rate and average result across different histories, and inspect how far prices moved above or below their starting point. Account access applies in TradeWave.
What winners endured
The yearly range chart covers the same seasonal period each year, not the whole calendar year. October 12–November 13, 2020 illustrates why a winning finish can conceal discomfort: shares ended up 4.36% but traded 4.77% below the starting price. The highs and lows show the range experienced, not their order or a peak-to-trough loss. They provide no forecast or predetermined exit point.[4]
What happened inside each seasonal window

View exact TradeWave observations and download
| Window starting year | Ending price change | Highest from entry | Lowest from entry |
|---|---|---|---|
| 2016 | +4.49% | +6.86% | -0.58% |
| 2017 | +5.68% | +6.83% | -1.25% |
| 2018 | +8.58% | +12.02% | -1.04% |
| 2019 | +1.52% | +1.84% | -1.96% |
| 2020 | +4.36% | +4.64% | -4.77% |
| 2021 | +5.40% | +9.05% | -0.90% |
| 2022 | +5.50% | +9.83% | -2.13% |
| 2023 | +5.49% | +5.61% | -0.59% |
| 2024 | +6.49% | +6.85% | +0.00% |
| 2025 | +0.41% | +7.31% | -2.05% |
Looking further back
To check whether recent strength holds across a longer history, the 2006–2025 comparison lowers the average full-window result to 2.39%; it includes all ten primary-study years. Ten selected midterm-election years spanning 1986–2022 had eight gains, broadly supporting the favorable reading but offering limited confidence. Their reuse of 2018 and 2022 from the primary study limits independent confirmation and does not establish an election effect.[4]
See the history behind this comparison
TradeWave checks the same seasonal dates across different sets of years. This helps show whether the pattern holds up when you look at another stretch of history.
| History | Observed start years | Direction | Success rate | Median result |
|---|---|---|---|---|
| Article study: 10 consecutive historical windows (2016–2025) | 2016, 2017, 2018, 2019, 2020, 2021, 2022, 2023, 2024, 2025 | long | 100.0% | 5.44% |
| 20 consecutive historical windows (2006–2025) | 2006, 2007, 2008, 2009, 2010, 2011, 2012, 2013, 2014, 2015, 2016, 2017, 2018, 2019, 2020, 2021, 2022, 2023, 2024, 2025 | long | 80.0% | 4.94% |
| 10 selected midterm-election years (1986–2022) | 1986, 1990, 1994, 1998, 2002, 2006, 2010, 2014, 2018, 2022 | long | 80.0% | 4.47% |
Some years appear in more than one group, so agreement is not an independent test. A requested lookback can extend beyond available history; the observed years are listed above. Election-cycle groups use matching phases, not consecutive years. Results follow the direction shown: a positive short result means prices fell. Small samples and different market periods make the comparison less conclusive.
Watch availability next
The next business question is whether nationwide pickup availability arrives as promised. Its reach at the October 12 entry remains unconfirmed.[1]
Recorded prices in the chart below end October 7, 2026, before entry. Its rescaled average seasonal path uses this article’s selected 2016–2025 years over the next 60 weekdays, October 8–December 30, 2026. That horizon is separate from the full seasonal window and illustrates historical shape, not future recorded prices, earnings or a price target. In TradeWave, inspect this same window across histories and compare ending returns with the ranges endured.[4]
Price history and the seasonal outlook

Explore this exact seasonal window in TradeWave. Compare its win rate and average result across different histories, and inspect how far prices moved above or below their starting point. Account access applies in TradeWave.
About this seasonal analysis
10 consecutive historical windows (2016–2025). The selected dates, years, direction, returns and ranges come from TradeWave. When a window boundary is a weekend or market holiday, TradeWave uses the next available trading session. SMN displays the returned results without recalculating them. A year label identifies the start of the historical window; a window can end in the following calendar year.
Green and red bars show the underlying adjusted-price movement. The range endpoints measure changes from the entry price, not a peak-to-trough loss. Historical results are before trading costs and do not guarantee future performance.