
Delta’s earnings outlook cut leaves shareholders asking how much confidence its favorable seasonal record deserves.[3][4]
At the evidence snapshot, the October 9, 2026-February 16, 2027 window's first regular US trading session had yet to begin. Fourteen of the 15 historical periods starting in 2011-2025 gained. The record favors this part of the calendar, while leaving open how much weakness shareholders might endure before the period ends.[4]
September versus July
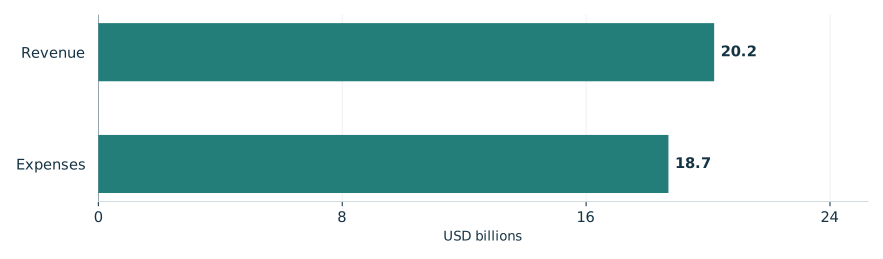
On an adjusted basis, September EPS was $1.72 and operating margin 9.4%, below July forecasts. Revenue grew 16% to $17.6 billion on flat capacity, supported by demand and yields. Fuel expense rose 62% to $4.1 billion, exceeding July assumptions by over $500 million. Nonfuel unit costs rose 7.3% from crew/revenue-related costs and below-plan capacity, including storms. The chart uses GAAP.[3][1]
The July 10 release forecast September adjusted EPS of $2.00-$2.50 and operating margin of 11%-13%, with mid-teens revenue growth on modest capacity growth. Its full-year 20% earnings-growth goal despite a fuel headwind accompanied adjusted EPS of $6.50-$7.50 and free cash flow of $3-$4 billion.[1]
July’s June-quarter account credited demand, brand preference and diversified revenue despite record fuel expense. Adjusted revenue grew 14%; premium grew 17% on yield strength and premium-seat investment. Loyalty grew 19%, with SkyMiles engagement extending beyond flights.[1]
September GAAP totals
Quarter ended September 30, 2026

View chart data & download
| Measure | Value | Period | Status |
|---|---|---|---|
| Revenue | 20.2 | September 2026 | reported |
| Expenses | 18.7 | September 2026 | reported |
Frequent gains, uneven results
TradeWave’s seasonal record provides context for the shares’ timing. Its 26.58% median long result summarizes complete periods before trading costs; the individual bars show why that figure should not become an expected gain from today. These are 15 consecutive historical windows, not a selected midterm-election sample. Their favorable record cannot establish whether Delta will meet its business forecasts.[4]
The year-by-year seasonal record

View exact TradeWave observations and download
| Window starting year | Ending price change | Highest from entry | Lowest from entry |
|---|---|---|---|
| 2011 | +35.78% | +43.85% | -12.05% |
| 2012 | +44.59% | +50.66% | -6.88% |
| 2013 | +27.79% | +36.06% | -1.98% |
| 2014 | +33.06% | +51.79% | -10.65% |
| 2015 | -5.02% | +12.07% | -14.98% |
| 2016 | +28.40% | +33.27% | -4.68% |
| 2017 | +2.78% | +18.22% | -6.59% |
| 2018 | +2.53% | +21.32% | -10.81% |
| 2019 | +9.71% | +16.74% | -5.29% |
| 2020 | +36.09% | +36.57% | -12.40% |
| 2021 | +2.82% | +5.39% | -22.67% |
| 2022 | +30.12% | +37.12% | -4.11% |
| 2023 | +14.04% | +21.37% | -13.02% |
| 2024 | +26.58% | +37.67% | -3.03% |
| 2025 | +19.30% | +28.63% | -7.34% |
Explore this exact seasonal window in TradeWave. Compare its win rate and average result across different histories, and inspect how far prices moved above or below their starting point. Account access applies in TradeWave.
What a positive finish concealed
The yearly range chart shows the same seasonal period for each year, rather than each whole calendar year. October 9, 2021-February 16, 2022 is useful because it finished up 2.82% despite falling 22.67% below the starting price during the window. That separates the ending result from the weakness endured inside it. The highs and lows reveal neither their order nor a peak-to-trough drawdown.[4]
Business seasonality also requires care. Delta’s June 10-Q cautioned that travel seasonality, fuel-price volatility and other factors meant June results were not necessarily indicative of the full year.[2]
What happened inside each seasonal window

View exact TradeWave observations and download
| Window starting year | Ending price change | Highest from entry | Lowest from entry |
|---|---|---|---|
| 2011 | +35.78% | +43.85% | -12.05% |
| 2012 | +44.59% | +50.66% | -6.88% |
| 2013 | +27.79% | +36.06% | -1.98% |
| 2014 | +33.06% | +51.79% | -10.65% |
| 2015 | -5.02% | +12.07% | -14.98% |
| 2016 | +28.40% | +33.27% | -4.68% |
| 2017 | +2.78% | +18.22% | -6.59% |
| 2018 | +2.53% | +21.32% | -10.81% |
| 2019 | +9.71% | +16.74% | -5.29% |
| 2020 | +36.09% | +36.57% | -12.40% |
| 2021 | +2.82% | +5.39% | -22.67% |
| 2022 | +30.12% | +37.12% | -4.11% |
| 2023 | +14.04% | +21.37% | -13.02% |
| 2024 | +26.58% | +37.67% | -3.03% |
| 2025 | +19.30% | +28.63% | -7.34% |
Agreement across overlapping histories
Checking 2008-2025 tests whether a longer history changes the reading: its 18 windows remained favorable, with a 22.94% median result. The four selected midterm years from 2010-2022 also gained, but offer little independent reassurance. The longer sample includes all 15 study years; the midterm sample shares three observations with the study and all four with the longer history.[4]
See the history behind this comparison
TradeWave checks the same seasonal dates across different sets of years. This helps show whether the pattern holds up when you look at another stretch of history.
| History | Observed start years | Direction | Success rate | Median result |
|---|---|---|---|---|
| Article study: 15 consecutive historical windows (2011–2025) | 2011, 2012, 2013, 2014, 2015, 2016, 2017, 2018, 2019, 2020, 2021, 2022, 2023, 2024, 2025 | long | 93.33% | 26.58% |
| 18 consecutive historical windows (2008–2025) | 2008, 2009, 2010, 2011, 2012, 2013, 2014, 2015, 2016, 2017, 2018, 2019, 2020, 2021, 2022, 2023, 2024, 2025 | long | 94.44% | 22.94% |
| 4 selected midterm-election years (2010–2022) | 2010, 2014, 2018, 2022 | long | 100.0% | 17.64% |
Some years appear in more than one group, so agreement is not an independent test. A requested lookback can extend beyond available history; the observed years are listed above. Election-cycle groups use matching phases, not consecutive years. Results follow the direction shown: a positive short result means prices fell. Small samples and different market periods make the comparison less conclusive.
Can December meet guidance?
Superseding July, 2026 guidance is adjusted EPS $5.10-$5.60 and free cash flow about $2.5 billion. December adjusted forecasts: revenue growth about 20%, operating margin 7%-9%, EPS $1.15-$1.65, assuming fuel around $4.25/gallon.[3]
Recorded prices end October 8, 2026. The following price chart superimposes TradeWave’s normalized average seasonal path using this article’s 15 historical windows starting in 2011-2025. It illustrates historical shape over the next 60 weekdays, October 9-December 31, a shorter horizon than the full seasonal window. Those future dates belong only to the illustration, not recorded prices. It predicts neither earnings nor a price target. In TradeWave, compare this same window across histories and inspect the yearly ranges behind its favorable finishes.[4]
Price history and the seasonal outlook

Explore this exact seasonal window in TradeWave. Compare its win rate and average result across different histories, and inspect how far prices moved above or below their starting point. Account access applies in TradeWave.
About this seasonal analysis
15 consecutive historical windows (2011–2025). The selected dates, years, direction, returns and ranges come from TradeWave. When a window boundary is a weekend or market holiday, TradeWave uses the next available trading session. SMN displays the returned results without recalculating them. A year label identifies the start of the historical window; a window can end in the following calendar year.
Green and red bars show the underlying adjusted-price movement. The range endpoints measure changes from the entry price, not a peak-to-trough loss. Historical results are before trading costs and do not guarantee future performance.
Sources & methodology
- Delta Air Lines Announces June Quarter 2026 Financial Results · 2026-07-10
- FORM 10-Q · 2026-07-10
- Delta Air Lines Announces September Quarter 2026 Financial Results · 2026-10-09
- TradeWave DAL seasonal evidence · 2026-10-09