
After QQQ's August gain, investors weighing an October entry face a practical question: how much confidence does its seasonal record deserve?[1][3]
The October 25, 2026–April 26, 2027 window is still ahead as of October 9. All six selected midterm precedents finished higher, while broader histories include losses. That makes this a timely period to examine, with the central question being whether favorable endings adequately describe the risk of holding QQQ through the window.[3]
August performance in context
Invesco QQQ tracks the Nasdaq-100 Index.[2]
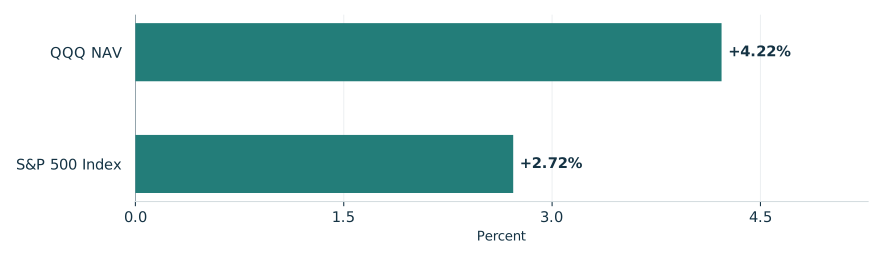
Invesco's September 17, 2026 review reported August returns of 4.22% at net asset value for QQQ and 2.72% for the S&P 500 Index. Different technology holdings and a larger average technology allocation chiefly drove relative outperformance; a smaller energy allocation was the largest relative detractor.[1]
August reported returns
QQQ NAV and S&P 500 Index

View chart data & download
| Measure | Value | Period | Status |
|---|---|---|---|
| QQQ NAV | +4.22% | August 2026 | reported |
| S&P 500 Index | +2.72% | August 2026 | reported |
Six selected midterm windows
TradeWave's study of six selected midterm-election years from 2002–2022 produced a median full-window long result of 11.61%. That favorable seasonal record concerns complete October-to-April periods, not returns available from today's price. The bars let readers compare the individual finishes behind the summary. Six observations support examining this calendar window, but cannot establish that midterm elections caused the gains or that the next window will repeat them.[3]
The year-by-year seasonal record

View exact TradeWave observations and download
| Window starting year | Ending price change | Highest from entry | Lowest from entry |
|---|---|---|---|
| 2002 | +11.25% | +16.56% | -5.59% |
| 2006 | +9.91% | +10.15% | -1.93% |
| 2010 | +13.74% | +14.15% | -2.00% |
| 2014 | +12.40% | +13.32% | +0.00% |
| 2018 | +11.97% | +12.31% | -15.89% |
| 2022 | +10.17% | +13.61% | -8.84% |
Explore this exact seasonal window in TradeWave. Compare its win rate and average result across different histories, and inspect how far prices moved above or below their starting point. Account access applies in TradeWave.
What a winning finish can conceal
The yearly range chart shows each year's same seasonal period, not the whole calendar year. October 25, 2018–April 26, 2019 illustrates why the ending result alone is insufficient: a positive 11.97% finish coexisted with a move 15.89% below the starting price. An investor holding throughout that period would have experienced a substantial loss along the way despite the favorable ending. The chart's highs and lows measure moves from the starting price; they do not establish their order, a peak-to-trough loss or a limit on future losses.[3]
What happened inside each seasonal window

View exact TradeWave observations and download
| Window starting year | Ending price change | Highest from entry | Lowest from entry |
|---|---|---|---|
| 2002 | +11.25% | +16.56% | -5.59% |
| 2006 | +9.91% | +10.15% | -1.93% |
| 2010 | +13.74% | +14.15% | -2.00% |
| 2014 | +12.40% | +13.32% | +0.00% |
| 2018 | +11.97% | +12.31% | -15.89% |
| 2022 | +10.17% | +13.61% | -8.84% |
Two broader histories
Checking across all years tests how much the favorable reading depends on selected midterms: windows beginning in 2016–2025 and 2006–2025 were both 80.0% profitable, weakening the perfect-record impression. Six selected observations limit confidence. The shorter comparison reuses 2018 and 2022; the longer reuses every selected year except 2002 and contains the shorter history, so agreement is not independent confirmation.[3]
See the history behind this comparison
TradeWave checks the same seasonal dates across different sets of years. This helps show whether the pattern holds up when you look at another stretch of history.
| History | Observed start years | Direction | Success rate | Median result |
|---|---|---|---|---|
| Article study: 6 selected midterm-election years (2002–2022) | 2002, 2006, 2010, 2014, 2018, 2022 | long | 100.0% | 11.61% |
| 10 consecutive historical windows (2016–2025) | 2016, 2017, 2018, 2019, 2020, 2021, 2022, 2023, 2024, 2025 | long | 80.0% | 10.47% |
| 20 consecutive historical windows (2006–2025) | 2006, 2007, 2008, 2009, 2010, 2011, 2012, 2013, 2014, 2015, 2016, 2017, 2018, 2019, 2020, 2021, 2022, 2023, 2024, 2025 | long | 80.0% | 10.47% |
Some years appear in more than one group, so agreement is not an independent test. A requested lookback can extend beyond available history; the observed years are listed above. Election-cycle groups use matching phases, not consecutive years. Results follow the direction shown: a positive short result means prices fell. Small samples and different market periods make the comparison less conclusive.
Historical shape before October 25
Recorded prices end October 8, 2026. The following price chart superimposes TradeWave's normalized average seasonal path using this article's six selected midterm years, allowing comparison of historical shape with recorded prices. Its illustration covers the next 60 weekdays, October 9–December 31, 2026, a separate horizon from the full seasonal window. Those future dates belong only to the illustration, not recorded prices; the path is neither a prediction nor a price target. Before October 25, the next question is how the favorable finishes compare with the losses endured. Inspect this same window across histories and its yearly ranges in TradeWave.[3]
Price history and the seasonal outlook

Explore this exact seasonal window in TradeWave. Compare its win rate and average result across different histories, and inspect how far prices moved above or below their starting point. Account access applies in TradeWave.
About this seasonal analysis
6 selected midterm-election years (2002–2022). The selected dates, years, direction, returns and ranges come from TradeWave. When a window boundary is a weekend or market holiday, TradeWave uses the next available trading session. SMN displays the returned results without recalculating them. A year label identifies the start of the historical window; a window can end in the following calendar year.
Green and red bars show the underlying adjusted-price movement. The range endpoints measure changes from the entry price, not a peak-to-trough loss. Historical results are before trading costs and do not guarantee future performance.
Sources & methodology
- Invesco QQQ monthly review · 2026-09-17
- Invesco QQQ overview (retrieved 2026-10-09) · 2026-10-09
- TradeWave QQQ seasonal evidence · 2026-10-09