
Can RPM sustain record earnings despite weak construction demand?[1]
For shareholders weighing that question, the approaching October 10–November 6, 2026 window adds a favorable seasonal reference. TradeWave found gains in all 10 selected midterm-election years from 1986–2022, although both broader histories included losses. With the window about to begin as of October 9, how much confidence does that selected winning streak deserve?[3]
Record earnings, construction pressure
RPM's record fiscal 2027 first-quarter adjusted EBITDA was $405.5 million, up 4.5%. Construction Products Group sales rose 0.8%; adjusted EBITDA fell 9.7%. Healthcare and education delays and supplier shortages hurt sales; Kalzip and pricing helped. Lower volumes, inflation, customer bankruptcy and warranties hurt profits; SG&A savings helped. Performance Coatings offset weakness; Consumer gained from shelf wins, products and pricing. Fiscal 2027 sales and adjusted EBITDA growth forecasts became mid-single-digit, replacing 3%-7% and 5%-10%.[1]
RPM also completed its acquisition of waterproofing supplier Volteco on October 1. Volteco generated approximately €28 million in calendar 2025 sales. That establishes the acquired business’s historical scale, but does not establish its future contribution to RPM.[2]
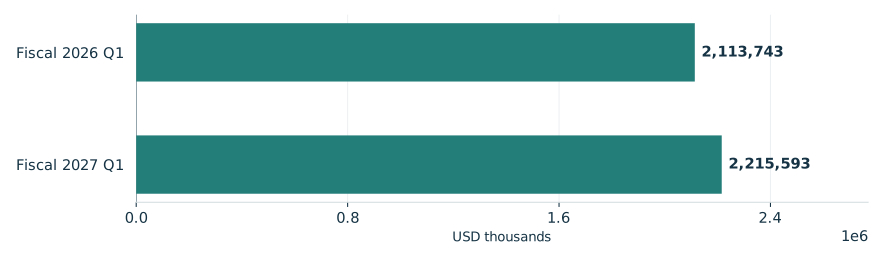
RPM’s reported quarterly sales increased
Consolidated net sales for quarters ended August 31

View chart data & download
| Measure | Value | Period | Status |
|---|---|---|---|
| Fiscal 2026 Q1 | 2,113,743 | Three months ended August 31, 2025 | reported |
| Fiscal 2027 Q1 | 2,215,593 | Three months ended August 31, 2026 | reported |
What the selected midterms show
TradeWave’s seasonal record puts the median full-window gain at 6.39%, before trading costs. The record chart shows the individual outcomes behind that result. These are gains across each complete October 10–November 6 period, not expected returns from today. Ten selected midterms provide a favorable historical reference, but their spread across different eras leaves election causation unproven and limits confidence in repeating the result.[3]
The year-by-year seasonal record

View exact TradeWave observations and download
| Window starting year | Ending price change | Highest from entry | Lowest from entry |
|---|---|---|---|
| 1986 | +6.70% | +11.97% | +0.00% |
| 1990 | +12.46% | +14.73% | -0.75% |
| 1994 | +2.03% | +2.68% | -8.43% |
| 1998 | +9.62% | +14.24% | -1.67% |
| 2002 | +15.23% | +16.39% | -1.30% |
| 2006 | +4.29% | +4.94% | -1.23% |
| 2010 | +3.50% | +5.74% | -2.65% |
| 2014 | +12.53% | +12.61% | -4.17% |
| 2018 | +6.08% | +6.35% | -3.30% |
| 2022 | +4.17% | +5.50% | -5.13% |
Explore this exact seasonal window in TradeWave. Compare its win rate and average result across different histories, and inspect how far prices moved above or below their starting point. Account access applies in TradeWave.
A winning finish could involve weakness
The yearly range chart shows the same seasonal period each year, rather than whole calendar years. October 10–November 6, 1994 is useful because its 2.03% ending gain coexisted with a low 8.43% below the starting price. A positive finish could therefore conceal substantial discomfort within the window. These highs and lows establish neither the order of moves nor a peak-to-trough loss, and they are not stop levels or forecasts.[3]
What happened inside each seasonal window

View exact TradeWave observations and download
| Window starting year | Ending price change | Highest from entry | Lowest from entry |
|---|---|---|---|
| 1986 | +6.70% | +11.97% | +0.00% |
| 1990 | +12.46% | +14.73% | -0.75% |
| 1994 | +2.03% | +2.68% | -8.43% |
| 1998 | +9.62% | +14.24% | -1.67% |
| 2002 | +15.23% | +16.39% | -1.30% |
| 2006 | +4.29% | +4.94% | -1.23% |
| 2010 | +3.50% | +5.74% | -2.65% |
| 2014 | +12.53% | +12.61% | -4.17% |
| 2018 | +6.08% | +6.35% | -3.30% |
| 2022 | +4.17% | +5.50% | -5.13% |
Broader histories temper confidence
Checking across all years tests whether the favorable reading survives a different selection: success was 70.0% in both 2016–2025 and 2006–2025. Those losses weaken confidence in the small midterm sample’s perfect record. The shorter comparison shares two years with the selected midterms; the longer shares five. The shorter history also sits entirely within the longer one, limiting independent confirmation.[3]
See the history behind this comparison
TradeWave checks the same seasonal dates across different sets of years. This helps show whether the pattern holds up when you look at another stretch of history.
| History | Observed start years | Direction | Success rate | Median result |
|---|---|---|---|---|
| Article study: 10 selected midterm-election years (1986–2022) | 1986, 1990, 1994, 1998, 2002, 2006, 2010, 2014, 2018, 2022 | long | 100.0% | 6.39% |
| 10 consecutive historical windows (2016–2025) | 2016, 2017, 2018, 2019, 2020, 2021, 2022, 2023, 2024, 2025 | long | 70.0% | 3.54% |
| 20 consecutive historical windows (2006–2025) | 2006, 2007, 2008, 2009, 2010, 2011, 2012, 2013, 2014, 2015, 2016, 2017, 2018, 2019, 2020, 2021, 2022, 2023, 2024, 2025 | long | 70.0% | 4.23% |
Some years appear in more than one group, so agreement is not an independent test. A requested lookback can extend beyond available history; the observed years are listed above. Election-cycle groups use matching phases, not consecutive years. Results follow the direction shown: a positive short result means prices fell. Small samples and different market periods make the comparison less conclusive.
Inspect the shape and the range
Recorded prices end October 8, 2026. The following chart superimposes TradeWave's normalized seasonal trend for this study's 10 selected midterm years on the price chart. The illustration covers the next 60 weekday steps, October 9-December 31, a separate horizon from the full seasonal window. It is historical shape, not future recorded prices, an expected return or a price target. Inspect the same window across histories and compare its yearly ranges in TradeWave.[3]
As the window approaches, the next question is how much weakness accompanied otherwise favorable outcomes. Inspect this same window across TradeWave’s supplied histories and compare the yearly ranges with the ending results.[3]
Price history and the seasonal outlook

Explore this exact seasonal window in TradeWave. Compare its win rate and average result across different histories, and inspect how far prices moved above or below their starting point. Account access applies in TradeWave.
About this seasonal analysis
10 selected midterm-election years (1986–2022). The selected dates, years, direction, returns and ranges come from TradeWave. When a window boundary is a weekend or market holiday, TradeWave uses the next available trading session. SMN displays the returned results without recalculating them. A year label identifies the start of the historical window; a window can end in the following calendar year.
Green and red bars show the underlying adjusted-price movement. The range endpoints measure changes from the entry price, not a peak-to-trough loss. Historical results are before trading costs and do not guarantee future performance.
Sources & methodology
- RPM Reports Record Fiscal 2027 First-Quarter Results · 2026-10-06
- RPM Completes Acquisition of Volteco · 2026-10-01
- TradeWave RPM seasonal evidence · 2026-10-09