
Investors in SPY, the investable SPDR S&P 500 ETF Trust, face a timely question: how much confidence should autumn strength inspire after the Fed raised rates in September? The seasonal record offers evidence about timing, while the economic reports describe the conditions investors face.[5][3]
The October 29–December 2 period approaching in 2026 finished higher in all seven selected midterm-election years from 1998–2022. Broader histories include losses, however, making this favorable seasonal record a reason to examine the window’s risks before it begins.[5]
Hiring, inflation and index context
The October 2 employment release reported September payroll growth of 29,000 and 4.2% unemployment, both described as little changed. July and August payroll changes were revised down by a combined 60,000, qualifying the recent hiring picture.[2]
On September 16, the Fed raised its target range a quarter point to 3.75%–4%, citing elevated inflation. It described solid economic expansion, resilient domestic spending, strong productivity growth and robust capital investment. Uncertainty remained elevated, partly because of geopolitical developments, alongside those signs of economic strength.[3]
An October 1 S&P Dow Jones Indices notice scheduled Twilio to join the S&P 500 before trading opened October 6. That prospective notice does not confirm completion of the change by this October 9 edition.[1]
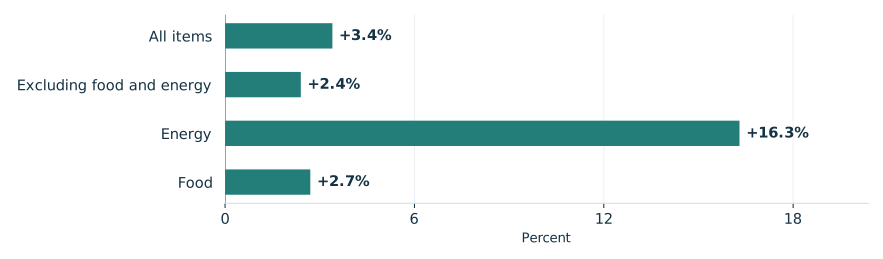
August inflation varied sharply by category
Reported CPI changes over the 12 months ending August 2026

View chart data & download
| Measure | Value | Period | Status |
|---|---|---|---|
| All items | +3.4% | 12 months ending August 2026 | reported |
| Excluding food and energy | +2.4% | 12 months ending August 2026 | reported |
| Energy | +16.3% | 12 months ending August 2026 | reported |
| Food | +2.7% | 12 months ending August 2026 | reported |
Seven favorable midterm windows
TradeWave’s seasonal record puts the rounded average across all seven complete windows at 5.03% before costs. The consistency is favorable, but seven selected observations cannot establish a dependable election effect. These results describe the entire historical period, not an expected return from today.[5]
The year-by-year seasonal record

View exact TradeWave observations and download
| Window starting year | Ending price change | Highest from entry | Lowest from entry |
|---|---|---|---|
| 1998 | +7.20% | +9.43% | +0.00% |
| 2002 | +6.28% | +8.45% | -1.26% |
| 2006 | +2.53% | +2.71% | -1.59% |
| 2010 | +3.43% | +3.76% | -0.76% |
| 2014 | +4.53% | +4.93% | -0.36% |
| 2018 | +5.85% | +6.58% | -0.30% |
| 2022 | +5.36% | +6.16% | -4.51% |
Explore this exact seasonal window in TradeWave. Compare its win rate and average result across different histories, and inspect how far prices moved above or below their starting point. Account access applies in TradeWave.
A gain can include a decline
The yearly range chart covers the same seasonal period each year, not the whole calendar year. The latest selected example, October 29–December 2, 2022, shows why the ending result alone is incomplete: SPY finished up 5.36% but traded 4.51% below the starting price. The highs and lows do not reveal their order or measure a peak-to-trough drawdown.[5]
What happened inside each seasonal window

View exact TradeWave observations and download
| Window starting year | Ending price change | Highest from entry | Lowest from entry |
|---|---|---|---|
| 1998 | +7.20% | +9.43% | +0.00% |
| 2002 | +6.28% | +8.45% | -1.26% |
| 2006 | +2.53% | +2.71% | -1.59% |
| 2010 | +3.43% | +3.76% | -0.76% |
| 2014 | +4.53% | +4.93% | -0.36% |
| 2018 | +5.85% | +6.58% | -0.30% |
| 2022 | +5.36% | +6.16% | -4.51% |
A broader history is less consistent
Checking across all years tests whether the favorable reading extends beyond the selected midterms. Success rates were 80.0% in 2016–2025 and 70.0% in 2006–2025, making the pattern less convincing further back. Both comparisons reuse selected midterm observations, and the shorter history sits entirely within the longer one, limiting independent confirmation. The differences do not establish an election effect.[5]
See the history behind this comparison
TradeWave checks the same seasonal dates across different sets of years. This helps show whether the pattern holds up when you look at another stretch of history.
| History | Observed start years | Direction | Success rate | Median result |
|---|---|---|---|---|
| Article study: 7 selected midterm-election years (1998–2022) | 1998, 2002, 2006, 2010, 2014, 2018, 2022 | long | 100.0% | 5.36% |
| 10 consecutive historical windows (2016–2025) | 2016, 2017, 2018, 2019, 2020, 2021, 2022, 2023, 2024, 2025 | long | 80.0% | 3.56% |
| 20 consecutive historical windows (2006–2025) | 2006, 2007, 2008, 2009, 2010, 2011, 2012, 2013, 2014, 2015, 2016, 2017, 2018, 2019, 2020, 2021, 2022, 2023, 2024, 2025 | long | 70.0% | 2.83% |
Some years appear in more than one group, so agreement is not an independent test. A requested lookback can extend beyond available history; the observed years are listed above. Election-cycle groups use matching phases, not consecutive years. Results follow the direction shown: a positive short result means prices fell. Small samples and different market periods make the comparison less conclusive.
What the saved releases establish
August CPI rose 3.4% over 12 months, or 2.4% excluding food and energy. Gasoline contributed over one third of the monthly rise. The September 11 release scheduled September CPI for October 14; that dated notice is not fresh confirmation.[4]
The October 2 jobs release scheduled October employment for November 6. This is the schedule stated in that release, rather than fresh confirmation as of October 9.[2]
Recorded prices end October 8, 2026. The following chart superimposes TradeWave's normalized seasonal trend for this study's seven selected midterm years on the price chart. The illustration covers the next 60 weekday steps, October 9-December 31, a separate horizon from the full seasonal window. It is historical shape, not future recorded prices, an expected return or a price target. Inspect the same window across histories and compare its yearly ranges in TradeWave.[5]
Price history and the seasonal outlook

Explore this exact seasonal window in TradeWave. Compare its win rate and average result across different histories, and inspect how far prices moved above or below their starting point. Account access applies in TradeWave.
About this seasonal analysis
7 selected midterm-election years (1998–2022). The selected dates, years, direction, returns and ranges come from TradeWave. When a window boundary is a weekend or market holiday, TradeWave uses the next available trading session. SMN displays the returned results without recalculating them. A year label identifies the start of the historical window; a window can end in the following calendar year.
Green and red bars show the underlying adjusted-price movement. The range endpoints measure changes from the entry price, not a peak-to-trough loss. Historical results are before trading costs and do not guarantee future performance.
Sources & methodology
- Vylor Added to the S&P 500; Twilio Set to Join S&P 500; Others to Join S&P MidCap 400 and S&P SmallCap 600 · 2026-10-01
- Employment Situation News Release · 2026-10-02
- Federal Reserve issues FOMC statement · 2026-09-16
- Consumer Price Index News Release · 2026-09-11
- TradeWave SPY seasonal evidence · 2026-10-09