
Will tomorrow’s JNJ results show progress toward July’s raised annual sales and adjusted EPS goals?[1][3]
The October 12–20 window opens today. JNJ rose in all 10 selected midterm-election years spanning 1986–2022, although consecutive-year histories were mixed. How much reassurance does that seasonal record offer shareholders awaiting the report?[4][3]
July’s outlook
July’s raised 2026 guidance targets $100.8–$101.4 billion sales and $11.60–$11.75 adjusted diluted EPS. Q2 2026 versus 2025: adjusted diluted EPS rose $2.77 to $2.90; GAAP fell $2.29 to $2.27.[1]
Management cited DARZALEX, CARVYKTI, TECVAYLI, RYBREVANT/LAZCLUZE, TREMFYA, SPRAVATO and CAPLYTA for Innovative Medicine’s operational growth, partly offset by STELARA and other declines. MedTech strength spanned surgery, cardiovascular, vision and orthopaedics.[1]
Uncertain, potentially material litigation, unusual gains/losses, acquisition expenses and purchase-accounting adjustments prevented GAAP guidance.[1]
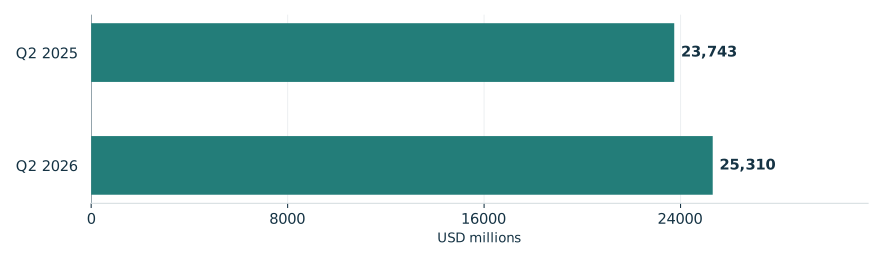
Johnson & Johnson’s reported Q2 sales
Worldwide sales for comparable quarters

View chart data & download
| Measure | Value | Period | Status |
|---|---|---|---|
| Q2 2025 | 23,743 | Q2 2025 | reported |
| Q2 2026 | 25,310 | Q2 2026 | reported |
What the midterm streak establishes
TradeWave’s selected midterm study gives the timing question historical substance: the median full-window long result was 4.54%. These are ten separate observations across 1986–2022, not ten consecutive years. They describe share performance over the complete seasonal period, rather than a return still available after it begins. They cannot establish how investors will receive this quarter’s results.[4]
The year-by-year seasonal record

View exact TradeWave observations and download
| Window starting year | Ending price change | Highest from entry | Lowest from entry |
|---|---|---|---|
| 1986 | +4.57% | +6.67% | -0.19% |
| 1990 | +6.23% | +7.39% | -0.20% |
| 1994 | +4.52% | +5.00% | -1.19% |
| 1998 | +6.30% | +10.22% | -0.57% |
| 2002 | +5.67% | +6.00% | -0.67% |
| 2006 | +5.83% | +6.63% | -0.52% |
| 2010 | +0.49% | +1.17% | -1.25% |
| 2014 | +0.08% | +1.80% | -4.06% |
| 2018 | +3.59% | +4.58% | -0.27% |
| 2022 | +1.49% | +2.78% | -1.19% |
Explore this exact seasonal window in TradeWave. Compare its win rate and average result across different histories, and inspect how far prices moved above or below their starting point. Account access applies in TradeWave.
A positive finish can conceal discomfort
The yearly range chart shows the same seasonal period each year, not whole calendar years. October 12–20, 2014 is useful because its 0.08% ending gain accompanied a move 4.06% below the starting price. A winning finish therefore did not mean an easy holding period. The highs and lows reveal neither their order nor a peak-to-trough loss, and they do not prescribe a stop or forecast a future range.[4]
What happened inside each seasonal window

View exact TradeWave observations and download
| Window starting year | Ending price change | Highest from entry | Lowest from entry |
|---|---|---|---|
| 1986 | +4.57% | +6.67% | -0.19% |
| 1990 | +6.23% | +7.39% | -0.20% |
| 1994 | +4.52% | +5.00% | -1.19% |
| 1998 | +6.30% | +10.22% | -0.57% |
| 2002 | +5.67% | +6.00% | -0.67% |
| 2006 | +5.83% | +6.63% | -0.52% |
| 2010 | +0.49% | +1.17% | -1.25% |
| 2014 | +0.08% | +1.80% | -4.06% |
| 2018 | +3.59% | +4.58% | -0.27% |
| 2022 | +1.49% | +2.78% | -1.19% |
Across all years, a weaker result
The other histories check whether strength extends across all years: success was 60.0% in 2016–2025 and 65.0% in 2006–2025, weakening reliance on ten favorable midterm observations. The shorter comparison reuses two selected midterm years, the longer five, and the shorter sits entirely within the longer. These overlapping histories offer limited independent confirmation and do not establish an election effect.[4]
See the history behind this comparison
TradeWave checks the same seasonal dates across different sets of years. This helps show whether the pattern holds up when you look at another stretch of history.
| History | Observed start years | Direction | Success rate | Median result |
|---|---|---|---|---|
| Article study: 10 selected midterm-election years (1986–2022) | 1986, 1990, 1994, 1998, 2002, 2006, 2010, 2014, 2018, 2022 | long | 100.0% | 4.54% |
| 10 consecutive historical windows (2016–2025) | 2016, 2017, 2018, 2019, 2020, 2021, 2022, 2023, 2024, 2025 | long | 60.0% | 1.12% |
| 20 consecutive historical windows (2006–2025) | 2006, 2007, 2008, 2009, 2010, 2011, 2012, 2013, 2014, 2015, 2016, 2017, 2018, 2019, 2020, 2021, 2022, 2023, 2024, 2025 | long | 65.0% | 1.12% |
Some years appear in more than one group, so agreement is not an independent test. A requested lookback can extend beyond available history; the observed years are listed above. Election-cycle groups use matching phases, not consecutive years. Results follow the direction shown: a positive short result means prices fell. Small samples and different market periods make the comparison less conclusive.
Tomorrow’s report and the historical illustration
The August 31 notice scheduled October 13 results for approximately 6:45 a.m. Eastern, followed by the investor call at 8:30 a.m. The business question is whether sales growth is accompanied by earnings progress, and what management says remains to be delivered this year.[3]
Recorded prices end October 9, 2026, so they cannot establish today’s starting price. The following chart overlays an average seasonal path from this article’s selected midterm years for the next 60 weekdays, October 12, 2026–January 1, 2027. That separate horizon extends beyond the full seasonal window. It illustrates historical shape, not future recorded prices, earnings or a price target. Inspect this same window’s outcomes and yearly ranges across histories in TradeWave.[4]
Price history and the seasonal outlook

Explore this exact seasonal window in TradeWave. Compare its win rate and average result across different histories, and inspect how far prices moved above or below their starting point. Account access applies in TradeWave.
About this seasonal analysis
10 selected midterm-election years (1986–2022). The selected dates, years, direction, returns and ranges come from TradeWave. When a window boundary is a weekend or market holiday, TradeWave uses the next available trading session. SMN displays the returned results without recalculating them. A year label identifies the start of the historical window; a window can end in the following calendar year.
Green and red bars show the underlying adjusted-price movement. The range endpoints measure changes from the entry price, not a peak-to-trough loss. Historical results are before trading costs and do not guarantee future performance.
Sources & methodology
- Johnson & Johnson reports Q2 2026 results, raises 2026 outlook · 2026-07-15
- New Johnson & Johnson ICOTYDE® (icotrokinra) long-term data demonstrate robust 2-year results in the treatment of adults and adolescents with plaque psoriasis · 2026-10-09
- Johnson & Johnson to Host Investor Conference Call on Third-Quarter Results · 2026-08-31
- TradeWave JNJ seasonal evidence · 2026-10-12