
Investors considering small caps face a timely question: how much weight should IWM’s autumn history carry while the inflation picture awaits another update? September CPI is scheduled for October 14.[3][2]
IWM, the iShares Russell 2000 ETF, gained in all six selected midterm-election windows from 2002–2022, although broader histories include losses. Its approaching October 24–December 2, 2026 window makes that favorable but limited record relevant now.[3]
What the latest reports establish
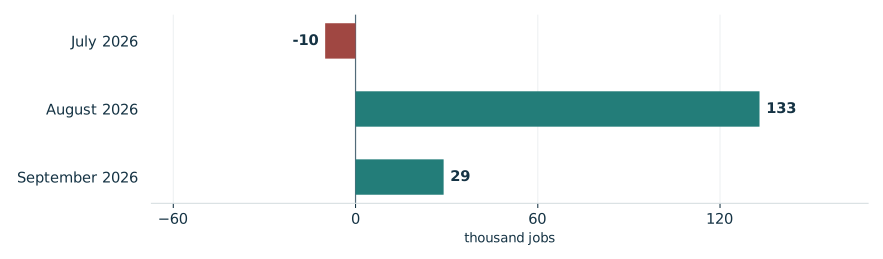
BLS’s October 2 release described September payroll growth of 29,000 and unemployment of 4.2% as little changed. Revised July payrolls fell 10,000; August gained 133,000, a combined downward revision of 60,000. October employment is scheduled for November 6, during the window; results are unavailable.[1][3]
The September 11 CPI release reported August prices up 0.4% for the month, versus July’s 0.1%, and 3.4% over 12 months. Gasoline accounted for more than one third of the monthly headline increase. September’s result is unavailable. This past inflation reading neither establishes October 24 conditions nor predicts IWM returns.[2]
Recent monthly payroll changes
U.S. nonfarm employment, reported by BLS on October 2, 2026

View chart data & download
| Measure | Value | Period | Status |
|---|---|---|---|
| July 2026 | -10 | July 2026 | reported |
| August 2026 | 133 | August 2026 | reported |
| September 2026 | 29 | September 2026 | reported |
A favorable midterm seasonal record
TradeWave’s selected study puts the median full-window long result at 5.89% before costs. That describes the complete 40-calendar-day period in selected midterm years, not consecutive years or a return available from today. Six observations cannot establish dependable odds.[3]
The year-by-year seasonal record

View exact TradeWave observations and download
| Window starting year | Ending price change | Highest from entry | Lowest from entry |
|---|---|---|---|
| 2002 | +11.78% | +13.60% | -0.92% |
| 2006 | +4.51% | +4.52% | -2.37% |
| 2010 | +6.21% | +6.43% | -2.02% |
| 2014 | +4.66% | +6.94% | -1.40% |
| 2018 | +5.57% | +8.19% | -0.86% |
| 2022 | +8.42% | +9.29% | +0.00% |
Explore this exact seasonal window in TradeWave. Compare its win rate and average result across different histories, and inspect how far prices moved above or below their starting point. Account access applies in TradeWave.
Winning finishes still included declines
The yearly range chart shows each year’s same seasonal period, not the whole calendar year. October 24–December 2, 2006 is useful because its 4.51% ending gain accompanied a move 2.37% below the starting price. Highs and lows reveal what the ending result misses; they establish neither the order of moves nor a peak-to-trough loss, stop or forecast.[3]
What happened inside each seasonal window

View exact TradeWave observations and download
| Window starting year | Ending price change | Highest from entry | Lowest from entry |
|---|---|---|---|
| 2002 | +11.78% | +13.60% | -0.92% |
| 2006 | +4.51% | +4.52% | -2.37% |
| 2010 | +6.21% | +6.43% | -2.02% |
| 2014 | +4.66% | +6.94% | -1.40% |
| 2018 | +5.57% | +8.19% | -0.86% |
| 2022 | +8.42% | +9.29% | +0.00% |
Looking across all years
Broader histories check whether the favorable reading extends across all years. Both 2016–2025 and 2006–2025 had 80.0% profitable windows, but their medians were 6.51% and 3.49%, respectively: gains look less convincing further back. Both reuse selected midterm observations, and the shorter history sits inside the longer, limiting independent confirmation. These differences do not establish an election effect.[3]
See the history behind this comparison
TradeWave checks the same seasonal dates across different sets of years. This helps show whether the pattern holds up when you look at another stretch of history.
| History | Observed start years | Direction | Success rate | Median result |
|---|---|---|---|---|
| Article study: 6 selected midterm-election years (2002–2022) | 2002, 2006, 2010, 2014, 2018, 2022 | long | 100.0% | 5.89% |
| 10 consecutive historical windows (2016–2025) | 2016, 2017, 2018, 2019, 2020, 2021, 2022, 2023, 2024, 2025 | long | 80.0% | 6.51% |
| 20 consecutive historical windows (2006–2025) | 2006, 2007, 2008, 2009, 2010, 2011, 2012, 2013, 2014, 2015, 2016, 2017, 2018, 2019, 2020, 2021, 2022, 2023, 2024, 2025 | long | 80.0% | 3.49% |
Some years appear in more than one group, so agreement is not an independent test. A requested lookback can extend beyond available history; the observed years are listed above. Election-cycle groups use matching phases, not consecutive years. Results follow the direction shown: a positive short result means prices fell. Small samples and different market periods make the comparison less conclusive.
Separate the next report from the illustration
October 14 CPI is the next scheduled opportunity to reassess inflation before entry.[2]
Below, recorded IWM prices end October 12, 2026. The normalized average seasonal path uses this article’s six selected midterm years over the next 60 weekdays, October 13–January 4, 2027, a separate horizon from the study window. Those future dates illustrate historical shape, not recorded prices, a prediction or a price target. Inspect the same window across histories and its range of outcomes in TradeWave.[3]
Price history and the seasonal outlook

Explore this exact seasonal window in TradeWave. Compare its win rate and average result across different histories, and inspect how far prices moved above or below their starting point. Account access applies in TradeWave.
About this seasonal analysis
6 selected midterm-election years (2002–2022). The selected dates, years, direction, returns and ranges come from TradeWave. When a window boundary is a weekend or market holiday, TradeWave uses the next available trading session. SMN displays the returned results without recalculating them. A year label identifies the start of the historical window; a window can end in the following calendar year.
Green and red bars show the underlying adjusted-price movement. The range endpoints measure changes from the entry price, not a peak-to-trough loss. Historical results are before trading costs and do not guarantee future performance.
Sources & methodology
- Employment Situation News Release · 2026-10-02
- Consumer Price Index News Release · 2026-09-11
- TradeWave IWM seasonal evidence · 2026-10-13