
Investors weighing protection against a stock-market fall face a timely question: how reassuring is a lower VIX when demand for downside hedges persists?[1]
TradeWave's October 10, 2026–February 15, 2027 short window is underway. VIX ended lower in all eight selected midterm-election windows from 1994–2022, although broader histories include sharp increases. That favorable seasonal record raises the question of whether easing can continue.[3]
Lower VIX, continuing protection demand
Cboe's October 12 digest reported VIX down 0.5 points week over week to 14.8. On the broader market, it wrote: “Implied volatilities among the major asset classes declined across the board as the primary drivers of cross-asset volatility contagion, rates and oil, both eased.” Cboe separately linked the relative strength of downside skew to positioning for protection against sharp falls. It said marginal demand for downside protection steepened one-month SPX 30-delta skew from the 9th to the 15th percentile.[1]
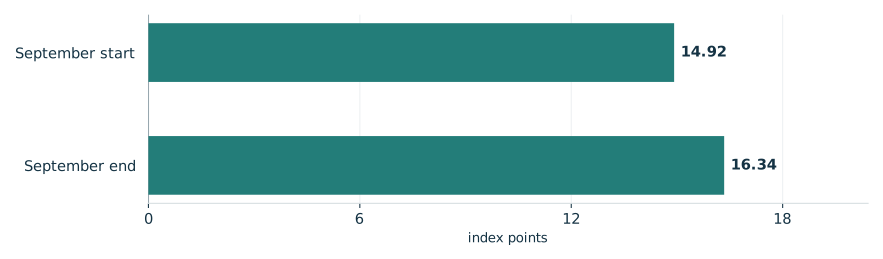
VIX reflects expected 30-day S&P 500 volatility inferred from SPX options. September moved differently: Cboe's October 9 review reported a 9.5% rise. The adjacent graphic shows that month's starting and ending levels, separately from the later weekly reading.[2]
VIX rose during September
Reported index levels in Cboe's September review

View chart data & download
| Measure | Value | Period | Status |
|---|---|---|---|
| September start | 14.92 | September 2026 start | reported |
| September end | 16.34 | September 2026 end | reported |
What the selected midterms show
TradeWave's selected seasonal record has a median direction-adjusted index change of 23.67%. Positive short-direction figures mean declining index levels; the bars show actual index changes. Complete-window results do not measure the change remaining today.[3]
Spot VIX cannot be bought or shorted directly. These index changes do not establish attainable profits from futures, options or exchange-traded products.[2]
The year-by-year seasonal record

View exact TradeWave observations and download
| Window starting year | Ending price change | Highest from entry | Lowest from entry |
|---|---|---|---|
| 1994 | -21.74% | +32.95% | -28.60% |
| 1998 | -26.00% | +3.82% | -49.89% |
| 2002 | -17.15% | +0.00% | -38.62% |
| 2006 | -11.28% | +11.37% | -18.49% |
| 2010 | -13.66% | +25.74% | -21.62% |
| 2014 | -25.61% | +46.23% | -45.72% |
| 2018 | -35.06% | +57.67% | -35.58% |
| 2022 | -43.82% | +6.41% | -47.43% |
Explore this exact seasonal window in TradeWave. Compare its win rate and average result across different histories, and inspect how far prices moved above or below their starting point. Account access applies in TradeWave.
A lower finish can conceal a surge
The yearly range chart shows the same seasonal period for each year, not the whole calendar year. October 10, 2018–February 15, 2019 is useful because VIX finished 35.06% lower yet reached 57.67% above its starting level. A favorable ending therefore concealed substantial movement against the study direction. The highs and lows reveal neither their order nor a peak-to-trough drawdown.[3]
What happened inside each seasonal window

View exact TradeWave observations and download
| Window starting year | Ending price change | Highest from entry | Lowest from entry |
|---|---|---|---|
| 1994 | -21.74% | +32.95% | -28.60% |
| 1998 | -26.00% | +3.82% | -49.89% |
| 2002 | -17.15% | +0.00% | -38.62% |
| 2006 | -11.28% | +11.37% | -18.49% |
| 2010 | -13.66% | +25.74% | -21.62% |
| 2014 | -25.61% | +46.23% | -45.72% |
| 2018 | -35.06% | +57.67% | -35.58% |
| 2022 | -43.82% | +6.41% | -47.43% |
Broader histories weaken the perfect record
Checking the same dates across all years tests how broadly the finding holds: windows starting in 2016–2025 and 2006–2025 both favored declines in 80.0% of cases. They share two and five observations with the selected study, respectively, and overlap each other. Agreement offers limited independent confirmation; eight selected midterms cannot establish an election effect.[3]
See the history behind this comparison
TradeWave checks the same seasonal dates across different sets of years. This helps show whether the pattern holds up when you look at another stretch of history.
| History | Observed start years | Direction | Success rate | Median result |
|---|---|---|---|---|
| Article study: 8 selected midterm-election years (1994–2022) | 1994, 1998, 2002, 2006, 2010, 2014, 2018, 2022 | short | 100.0% | 23.67% |
| 10 consecutive historical windows (2016–2025) | 2016, 2017, 2018, 2019, 2020, 2021, 2022, 2023, 2024, 2025 | short | 80.0% | 15.0% |
| 20 consecutive historical windows (2006–2025) | 2006, 2007, 2008, 2009, 2010, 2011, 2012, 2013, 2014, 2015, 2016, 2017, 2018, 2019, 2020, 2021, 2022, 2023, 2024, 2025 | short | 80.0% | 15.0% |
Some years appear in more than one group, so agreement is not an independent test. A requested lookback can extend beyond available history; the observed years are listed above. Election-cycle groups use matching phases, not consecutive years. Results follow the direction shown: a positive short result means prices fell. Small samples and different market periods make the comparison less conclusive.
Watch protection demand alongside VIX
The next question is whether lower VIX readings continue alongside demand for protection.[1]
Recorded index levels end October 12, 2026. The illustration below overlays an average seasonal path from this article's selected years, rescaled for comparison, for the next 60 weekdays, October 13, 2026–January 4, 2027. That horizon is shorter than the full seasonal window and illustrates historical shape, not future recorded levels or a target. In TradeWave, compare this same window across histories and inspect its range of outcomes.[3]
Price history and the seasonal outlook

Explore this exact seasonal window in TradeWave. Compare its win rate and average result across different histories, and inspect how far prices moved above or below their starting point. Account access applies in TradeWave.
About this seasonal analysis
8 selected midterm-election years (1994–2022). The selected dates, years, direction, returns and ranges come from TradeWave. When a window boundary is a weekend or market holiday, TradeWave uses the next available trading session. SMN displays the returned results without recalculating them. A year label identifies the start of the historical window; a window can end in the following calendar year.
Green and red bars show the underlying adjusted-price movement. The range endpoints measure changes from the entry price, not a peak-to-trough loss. Historical results are before trading costs and do not guarantee future performance.
Sources & methodology
- Volatilities Fall on Oil/Yield Reprieve as the S&P Rallies Into Earnings Season · 2026-10-12
- Index Insights: September 2026 · 2026-10-09
- TradeWave VIX seasonal evidence · 2026-10-13