Microsoft’s October 12 announcement that Maia 200 serves production workloads raises a question for shareholders: can expanding its own AI chips improve profitability?[3]
For Microsoft common stock (Nasdaq: MSFT), October 11–20 is already underway. All nine selected midterm-year windows from 1990–2022 finished higher, although broader histories were weaker. How useful is that favorable seasonal timing now?[5][4]
Maia’s financial stakes
Maia 200 supports Copilot and the MAI team; GitHub Copilot and Foundry are planned for year-end. Microsoft plans multi-gigawatt Maia deployments and Maia 300 production deployments in 2027. Its expectation of 40% more tokens per megawatt than leading GPU-based systems is a technical claim, not a reported financial return.[3]
Results published July 29 for the quarter ended June 30 provide the baseline: Cloud revenue reached $59.3 billion, up 27% year over year. Capital expenditures were $41 billion, including higher component pricing. Company gross margin fell year over year to 67%; management cited Azure sales mix, AI infrastructure investment and growing usage, partly offset by efficiency gains.[2]
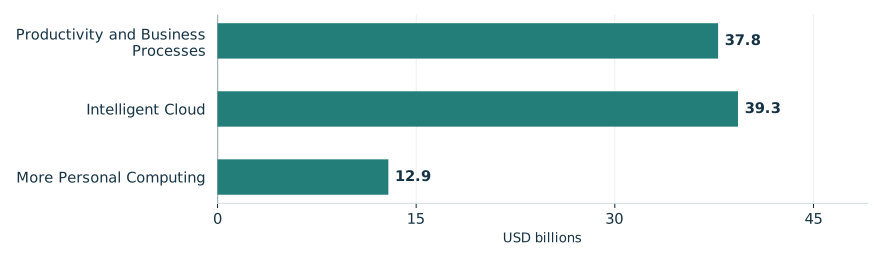
More Personal Computing revenue fell 4%, qualifying the cloud-led growth picture.[1]
Microsoft’s reported fourth-quarter revenue by segment
Quarter ended June 30, 2026

View chart data & download
| Measure | Value | Period | Status |
|---|---|---|---|
| Productivity and Business Processes | 37.8 | FY2026 Q4, quarter ended 2026-06-30 | reported |
| Intelligent Cloud | 39.3 | FY2026 Q4, quarter ended 2026-06-30 | reported |
| More Personal Computing | 12.9 | FY2026 Q4, quarter ended 2026-06-30 | reported |
A favorable, already-started window
TradeWave’s selected seasonal record shows a 3.51% median full-window gain. The October 11 start has passed, and the saved evidence supplies no entry price or executable trade. That historical result is not the return remaining today.[5]
The year-by-year seasonal record

View exact TradeWave observations and download
| Window starting year | Ending price change | Highest from entry | Lowest from entry |
|---|---|---|---|
| 1990 | +10.35% | +11.64% | -7.76% |
| 1994 | +6.83% | +7.27% | -1.46% |
| 1998 | +0.50% | +6.77% | -4.01% |
| 2002 | +7.45% | +8.86% | -2.11% |
| 2006 | +3.23% | +4.21% | +0.00% |
| 2010 | +2.93% | +5.53% | -0.65% |
| 2014 | +0.98% | +1.67% | -3.55% |
| 2018 | +3.51% | +5.57% | +0.00% |
| 2022 | +4.76% | +8.22% | -2.79% |
Explore this exact seasonal window in TradeWave. Compare its win rate and average result across different histories, and inspect how far prices moved above or below their starting point. Account access applies in TradeWave.
What a winning finish can conceal
The yearly range chart covers the same seasonal period each year, not whole calendar years. The latest selected example, October 11–20, 2022, illustrates the distinction: shares finished up 4.76% but traded 2.79% below the starting price. Those highs and lows establish neither their order nor a peak-to-trough drawdown.[5]
What happened inside each seasonal window

View exact TradeWave observations and download
| Window starting year | Ending price change | Highest from entry | Lowest from entry |
|---|---|---|---|
| 1990 | +10.35% | +11.64% | -7.76% |
| 1994 | +6.83% | +7.27% | -1.46% |
| 1998 | +0.50% | +6.77% | -4.01% |
| 2002 | +7.45% | +8.86% | -2.11% |
| 2006 | +3.23% | +4.21% | +0.00% |
| 2010 | +2.93% | +5.53% | -0.65% |
| 2014 | +0.98% | +1.67% | -3.55% |
| 2018 | +3.51% | +5.57% | +0.00% |
| 2022 | +4.76% | +8.22% | -2.79% |
Broader histories temper confidence
Checking across all years tests how widely the strength holds: the 2016–2025 median was 0.56%, versus 3.51% for selected midterms; 2006–2025 also included losses. Each comparison reuses selected midterm observations, and the shorter history sits inside the longer. Different periods and only nine selected observations limit confidence in an election explanation.[5]
See the history behind this comparison
TradeWave checks the same seasonal dates across different sets of years. This helps show whether the pattern holds up when you look at another stretch of history.
| History | Observed start years | Direction | Success rate | Median result |
|---|---|---|---|---|
| Article study: 9 selected midterm-election years (1990–2022) | 1990, 1994, 1998, 2002, 2006, 2010, 2014, 2018, 2022 | long | 100.0% | 3.51% |
| 10 consecutive historical windows (2016–2025) | 2016, 2017, 2018, 2019, 2020, 2021, 2022, 2023, 2024, 2025 | long | 70.0% | 0.56% |
| 20 consecutive historical windows (2006–2025) | 2006, 2007, 2008, 2009, 2010, 2011, 2012, 2013, 2014, 2015, 2016, 2017, 2018, 2019, 2020, 2021, 2022, 2023, 2024, 2025 | long | 75.0% | 1.31% |
Some years appear in more than one group, so agreement is not an independent test. A requested lookback can extend beyond available history; the observed years are listed above. Election-cycle groups use matching phases, not consecutive years. Results follow the direction shown: a positive short result means prices fell. Small samples and different market periods make the comparison less conclusive.
From historical timing to earnings
After this window, fiscal first-quarter results arrive October 28 after market close, with a 2:30 p.m. Pacific webcast. The question remains whether efficiency gains can ease margin pressure.[4][2]
Recorded prices below end October 13, 2026. The selected nine midterm years supply an average seasonal path scaled onto the price chart for the next 60 weekdays, October 14, 2026–January 5, 2027. This separate horizon illustrates historical shape, not future prices or a target. Inspect the same window across histories and its range of outcomes in TradeWave.[5]
Price history and the seasonal outlook

Explore this exact seasonal window in TradeWave. Compare its win rate and average result across different histories, and inspect how far prices moved above or below their starting point. Account access applies in TradeWave.
About this seasonal analysis
9 selected midterm-election years (1990–2022). The selected dates, years, direction, returns and ranges come from TradeWave. When a window boundary is a weekend or market holiday, TradeWave uses the next available trading session. SMN displays the returned results without recalculating them. A year label identifies the start of the historical window; a window can end in the following calendar year.
Green and red bars show the underlying adjusted-price movement. The range endpoints measure changes from the entry price, not a peak-to-trough loss. Historical results are before trading costs and do not guarantee future performance.
Sources & methodology
- Microsoft Cloud and AI Strength Fuels Fourth Quarter Results · 2026-07-29
- Microsoft Fiscal Year 2026 Fourth Quarter Earnings Conference Call · 2026-07-29
- Microsoft to expand Azure Maia system to multi-gigawatt deployments · 2026-10-12
- Microsoft announces quarterly earnings release date · 2026-10-07
- TradeWave MSFT seasonal evidence · 2026-10-14