QQQ investors face a question about dependence: how much rests on a handful of large companies? Invesco’s October 6 assessment warns that concentrated Nasdaq-100 performance increases that reliance for investors in its QQQ fund.[1]
The approaching October 25–April 26 window adds a timing question. All six selected midterm windows finished higher, although broader histories include losses. With AMD reporting November 3, how much confidence should that favorable seasonal record command?[4][3]
AI demand and the earnings calendar
NVIDIA’s August 26 report put fiscal second-quarter revenue, for the period ended July 26, 2026, at $96.2 billion, up 106% from $46.743 billion a year earlier. CEO Jensen Huang described accelerating demand across AI labs, startups, open models and physical AI, saying, “The AI infrastructure buildout is at full steam.”[2]
Its fiscal third-quarter forecast was $108.0 billion, ±2%, assuming no Data Center compute revenue from China. Both GAAP and non-GAAP gross margins were projected at 74.0%, ±50 basis points; respective operating expenses were approximately $9.2 billion and $9.0 billion.[2]
AMD’s fiscal third-quarter results remain upcoming: November 3, 2026, after market close. Its October 6 scheduling notice supplies no results or current QQQ weight.[3]
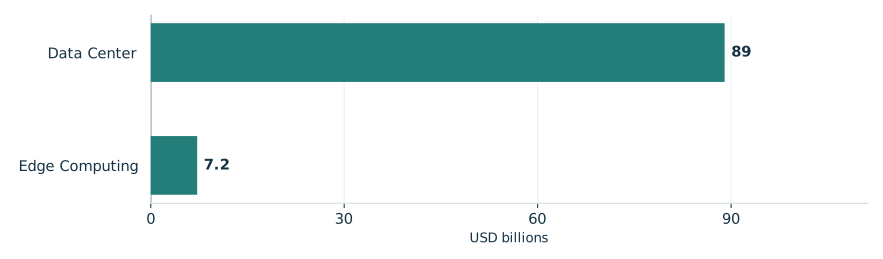
NVIDIA’s reported second-quarter revenue by business
Fiscal second quarter ended July 26, 2026

View chart data & download
| Measure | Value | Period | Status |
|---|---|---|---|
| Data Center | 89 | Q2 FY2027, ended 2026-07-26 | reported |
| Edge Computing | 7.2 | Q2 FY2027, ended 2026-07-26 | reported |
Six favorable midterm windows
TradeWave’s selected midterm years span 2002–2022, with an 11.61% median full-window long result. That supports a favorable historical reading, without establishing an election-driven explanation. The proposed October 25, 2026–April 26, 2027 period has yet to begin; October 13 observations cannot establish conditions at entry.[4]
The year-by-year seasonal record

View exact TradeWave observations and download
| Window starting year | Ending price change | Highest from entry | Lowest from entry |
|---|---|---|---|
| 2002 | +11.25% | +16.56% | -5.59% |
| 2006 | +9.91% | +10.15% | -1.93% |
| 2010 | +13.74% | +14.15% | -2.00% |
| 2014 | +12.40% | +13.32% | +0.00% |
| 2018 | +11.97% | +12.31% | -15.89% |
| 2022 | +10.17% | +13.61% | -8.84% |
Explore this exact seasonal window in TradeWave. Compare its win rate and average result across different histories, and inspect how far prices moved above or below their starting point. Account access applies in TradeWave.
A gain could conceal a difficult holding period
The yearly range chart shows the same seasonal period each year, not whole calendar years. October 25, 2018–April 26, 2019 is useful because its 11.97% ending gain accompanied a move 15.89% below the starting price. Highs and lows reveal what the finish conceals, without establishing their order or a peak-to-trough drawdown.[4]
What happened inside each seasonal window

View exact TradeWave observations and download
| Window starting year | Ending price change | Highest from entry | Lowest from entry |
|---|---|---|---|
| 2002 | +11.25% | +16.56% | -5.59% |
| 2006 | +9.91% | +10.15% | -1.93% |
| 2010 | +13.74% | +14.15% | -2.00% |
| 2014 | +12.40% | +13.32% | +0.00% |
| 2018 | +11.97% | +12.31% | -15.89% |
| 2022 | +10.17% | +13.61% | -8.84% |
Broader histories temper the perfect record
Checking across all years tests whether the favorable reading extends beyond midterms. Both 2016–2025 and 2006–2025 show 80.0% profitable windows, tempering confidence in six selected successes. The shorter history reuses 2018 and 2022; the longer reuses every selected year except 2002. They also share the entire shorter history, limiting independent confirmation.[4]
See the history behind this comparison
TradeWave checks the same seasonal dates across different sets of years. This helps show whether the pattern holds up when you look at another stretch of history.
| History | Observed start years | Direction | Success rate | Median result |
|---|---|---|---|---|
| Article study: 6 selected midterm-election years (2002–2022) | 2002, 2006, 2010, 2014, 2018, 2022 | long | 100.0% | 11.61% |
| 10 consecutive historical windows (2016–2025) | 2016, 2017, 2018, 2019, 2020, 2021, 2022, 2023, 2024, 2025 | long | 80.0% | 10.47% |
| 20 consecutive historical windows (2006–2025) | 2006, 2007, 2008, 2009, 2010, 2011, 2012, 2013, 2014, 2015, 2016, 2017, 2018, 2019, 2020, 2021, 2022, 2023, 2024, 2025 | long | 80.0% | 10.47% |
Some years appear in more than one group, so agreement is not an independent test. A requested lookback can extend beyond available history; the observed years are listed above. Election-cycle groups use matching phases, not consecutive years. Results follow the direction shown: a positive short result means prices fell. Small samples and different market periods make the comparison less conclusive.
What to inspect next
The price chart below shows recorded prices through October 13, 2026. Its rescaled average seasonal path uses this article’s same six selected midterm years over the next 60 weekdays, October 14, 2026–January 5, 2027, a separate horizon from the full seasonal window. That future span illustrates historical shape, not recorded prices, an earnings prediction or a price target.[4]
As AMD’s November 3 report approaches, inspect TradeWave’s same-window outcomes: how much variation accompanied those favorable finishes?[3][4]
Price history and the seasonal outlook

Explore this exact seasonal window in TradeWave. Compare its win rate and average result across different histories, and inspect how far prices moved above or below their starting point. Account access applies in TradeWave.
About this seasonal analysis
6 selected midterm-election years (2002–2022). The selected dates, years, direction, returns and ranges come from TradeWave. When a window boundary is a weekend or market holiday, TradeWave uses the next available trading session. SMN displays the returned results without recalculating them. A year label identifies the start of the historical window; a window can end in the following calendar year.
Green and red bars show the underlying adjusted-price movement. The range endpoints measure changes from the entry price, not a peak-to-trough loss. Historical results are before trading costs and do not guarantee future performance.
Sources & methodology
- Building versatile portfolios with the QQQ Innovation Suite · 2026-10-06
- NVIDIA Announces Financial Results for Second Quarter Fiscal 2027 · 2026-08-26
- AMD to Report Fiscal Third Quarter 2026 Financial Results · 2026-10-06
- TradeWave QQQ seasonal evidence · 2026-10-14