After September's Federal Reserve rate increase, investors face a practical question: how much reassurance does the S&P 500's approaching seasonal window offer?[2][4]
The October 31, 2026–July 22, 2027 window gained in all 15 selected midterm-election years spanning 1966–2022. That favorable seasonal record has limits: broader histories include losses.[4]
Inflation before entry
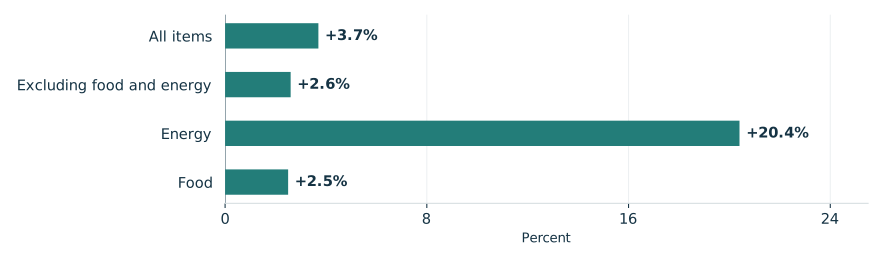
BLS's October 14 release put September CPI at 0.6% monthly and 3.7% annually, versus August's 3.4%. Gasoline rose 9.1%, explaining over half the monthly increase. Excluding food and energy, prices rose 0.3% monthly and 2.6% annually, up from 2.4%. October CPI is due November 10, after entry.[1]
On September 16, the Fed raised its target range a quarter percentage point to 3.75%–4%, while describing spending as resilient and investment as robust despite elevated uncertainty.[2]
BEA's September 30 release reported August real consumer spending up 0.6% monthly and annual PCE inflation of 3.4%.[3]
September inflation varied across price categories
CPI-U, 12-month unadjusted changes through September 2026

View chart data & download
| Measure | Value | Period | Status |
|---|---|---|---|
| All items | +3.7% | 12 months ending September 2026 | reported |
| Excluding food and energy | +2.6% | 12 months ending September 2026 | reported |
| Energy | +20.4% | 12 months ending September 2026 | reported |
| Food | +2.5% | 12 months ending September 2026 | reported |
What the selected history offers
TradeWave's selected seasonal record shows a 17.63% median full-window gain. The S&P 500 is a spot index, not directly investable; its changes do not establish attainable profits on futures, options or exchange-traded products.[4]
The year-by-year seasonal record

View exact TradeWave observations and download
| Window starting year | Ending price change | Highest from entry | Lowest from entry |
|---|---|---|---|
| 1966 | +16.87% | +18.77% | -1.63% |
| 1970 | +18.68% | +26.45% | -1.53% |
| 1974 | +23.75% | +30.69% | -13.22% |
| 1978 | +9.06% | +12.90% | -1.48% |
| 1982 | +24.67% | +26.67% | -1.90% |
| 1986 | +26.43% | +28.94% | -3.47% |
| 1990 | +25.95% | +28.70% | -0.79% |
| 1994 | +17.84% | +19.18% | -6.24% |
| 1998 | +22.43% | +27.77% | -0.47% |
| 2002 | +11.56% | +14.64% | -10.94% |
| 2006 | +11.87% | +12.91% | -1.23% |
| 2010 | +13.56% | +15.72% | -0.96% |
| 2014 | +4.76% | +5.78% | -2.25% |
| 2018 | +10.08% | +11.29% | -13.47% |
| 2022 | +17.63% | +18.25% | -4.49% |
Explore this exact seasonal window in TradeWave. Compare its win rate and average result across different histories, and inspect how far prices moved above or below their starting point. Account access applies in TradeWave.
A gain can conceal discomfort
The yearly range chart covers the same seasonal period each year, not whole calendar years. October 31, 2018–July 22, 2019 illustrates the difference between finishing ahead and enduring losses: it gained 10.08% but reached 13.47% below the starting level. Highs and lows reveal neither their order nor peak-to-trough drawdown, and supply no forecast or stop level.[4]
What happened inside each seasonal window

View exact TradeWave observations and download
| Window starting year | Ending price change | Highest from entry | Lowest from entry |
|---|---|---|---|
| 1966 | +16.87% | +18.77% | -1.63% |
| 1970 | +18.68% | +26.45% | -1.53% |
| 1974 | +23.75% | +30.69% | -13.22% |
| 1978 | +9.06% | +12.90% | -1.48% |
| 1982 | +24.67% | +26.67% | -1.90% |
| 1986 | +26.43% | +28.94% | -3.47% |
| 1990 | +25.95% | +28.70% | -0.79% |
| 1994 | +17.84% | +19.18% | -6.24% |
| 1998 | +22.43% | +27.77% | -0.47% |
| 2002 | +11.56% | +14.64% | -10.94% |
| 2006 | +11.87% | +12.91% | -1.23% |
| 2010 | +13.56% | +15.72% | -0.96% |
| 2014 | +4.76% | +5.78% | -2.25% |
| 2018 | +10.08% | +11.29% | -13.47% |
| 2022 | +17.63% | +18.25% | -4.49% |
Broader histories temper confidence
Checking across all years tests whether the favorable reading extends beyond midterms. Success rates were 90.0% for 2016–2025 and 85.0% for 2006–2025: favorable, but less convincing further back. These histories reuse two and five selected midterm observations, respectively; the shorter is contained in the longer. Limited, overlapping samples cannot establish an election effect.[4]
See the history behind this comparison
TradeWave checks the same seasonal dates across different sets of years. This helps show whether the pattern holds up when you look at another stretch of history.
| History | Observed start years | Direction | Success rate | Median result |
|---|---|---|---|---|
| Article study: 15 selected midterm-election years (1966–2022) | 1966, 1970, 1974, 1978, 1982, 1986, 1990, 1994, 1998, 2002, 2006, 2010, 2014, 2018, 2022 | long | 100.0% | 17.63% |
| 10 consecutive historical windows (2016–2025) | 2016, 2017, 2018, 2019, 2020, 2021, 2022, 2023, 2024, 2025 | long | 90.0% | 10.34% |
| 20 consecutive historical windows (2006–2025) | 2006, 2007, 2008, 2009, 2010, 2011, 2012, 2013, 2014, 2015, 2016, 2017, 2018, 2019, 2020, 2021, 2022, 2023, 2024, 2025 | long | 85.0% | 9.86% |
Some years appear in more than one group, so agreement is not an independent test. A requested lookback can extend beyond available history; the observed years are listed above. Election-cycle groups use matching phases, not consecutive years. Results follow the direction shown: a positive short result means prices fell. Small samples and different market periods make the comparison less conclusive.
The next evidence to inspect
BEA's September report, scheduled October 29 before entry, next updates spending and inflation. PCE and CPI cover different periods and price baskets.[3][1]
Recorded prices end October 14, 2026, so cannot establish October 31 conditions. The chart below overlays the selected midterm years' normalized average seasonal path for the next 60 weekdays, October 15–January 6, 2027. Those future dates illustrate historical shape over a separate, shorter horizon than the full window, not recorded prices or a target. Inspect this same window's range of outcomes in TradeWave.[4]
Price history and the seasonal outlook

Explore this exact seasonal window in TradeWave. Compare its win rate and average result across different histories, and inspect how far prices moved above or below their starting point. Account access applies in TradeWave.
About this seasonal analysis
15 selected midterm-election years (1966–2022). The selected dates, years, direction, returns and ranges come from TradeWave. When a window boundary is a weekend or market holiday, TradeWave uses the next available trading session. SMN displays the returned results without recalculating them. A year label identifies the start of the historical window; a window can end in the following calendar year.
Green and red bars show the underlying adjusted-price movement. The range endpoints measure changes from the entry price, not a peak-to-trough loss. Historical results are before trading costs and do not guarantee future performance.
Sources & methodology
- Consumer Price Index News Release · 2026-10-14
- Federal Reserve issues FOMC statement · 2026-09-16
- Personal Income and Outlays, August 2026 · 2026-09-30
- TradeWave SPX seasonal evidence · 2026-10-15