
Can State Street sustain its stronger earnings as a historically favorable period for its shares approaches? Its October 14 results give investors business momentum to assess alongside the seasonal opportunity.[1][4]
Ahead of October 26, TradeWave shows gains in all ten 2016–2025 windows through January 15, although longer history includes losses. Does that consistency justify confidence in the timing?[4]
Growth and its qualifications
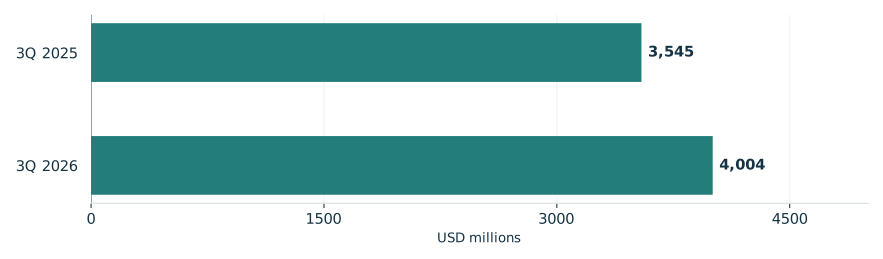
Third-quarter 2026 revenue rose 13% to $4.004 billion from $3.545 billion a year earlier; diluted EPS reached $3.69 versus $2.78. Both fees and net interest income supported revenue growth.[1]
Servicing benefited from organic growth and higher markets. Management fees benefited from higher markets and $69 billion of long-term inflows, partly offset by $62 billion of cash outflows. FX revenue rose year over year on client volumes but fell sequentially on a lower emerging-markets mix. Other fees fell 29% amid market-related adjustments. Expenses rose 8% on revenue-related costs and strategic investment.[1]
The October 14 presentation raised full-year fee and net interest income growth forecasts to about 13–14% and 15–16%, respectively, with expenses up about 8–8.5% and operating leverage above 500 basis points. These ex-notable-item, non-GAAP forecasts assume flat equity markets and rates broadly following forward rates. They remain uncertain and are not equivalents of reported quarterly comparisons.[2]
State Street’s reported quarterly revenue
Third-quarter revenue, GAAP basis

View chart data & download
| Measure | Value | Period | Status |
|---|---|---|---|
| 3Q 2025 | 3,545 | 3Q 2025 | reported |
| 3Q 2026 | 4,004 | 3Q 2026 | reported |
What the seasonal record offers
TradeWave’s selected seasonal record has a 15.29% median full-window gain. That describes completed periods, not an expected return. The October 26, 2026–January 15, 2027 window remains ahead; observations end October 19.[4]
The year-by-year seasonal record

View exact TradeWave observations and download
| Window starting year | Ending price change | Highest from entry | Lowest from entry |
|---|---|---|---|
| 2016 | +14.82% | +19.53% | -1.00% |
| 2017 | +12.33% | +15.02% | -5.34% |
| 2018 | +4.19% | +13.42% | -12.83% |
| 2019 | +21.79% | +24.38% | -2.64% |
| 2020 | +22.40% | +28.59% | -10.00% |
| 2021 | +3.42% | +7.37% | -10.31% |
| 2022 | +15.76% | +17.37% | +0.00% |
| 2023 | +18.38% | +22.86% | -2.91% |
| 2024 | +8.14% | +9.60% | -1.04% |
| 2025 | +17.22% | +17.87% | -4.61% |
Explore this exact seasonal window in TradeWave. Compare its win rate and average result across different histories, and inspect how far prices moved above or below their starting point. Account access applies in TradeWave.
A winning finish can conceal losses
The yearly range chart covers the same seasonal period each year, not whole calendar years. October 26, 2018–January 15, 2019 illustrates the distinction: a 4.19% ending gain accompanied a move 12.83% below the starting price. Highs and lows reveal discomfort hidden by the finish, not their order or peak-to-trough losses.[4]
What happened inside each seasonal window

View exact TradeWave observations and download
| Window starting year | Ending price change | Highest from entry | Lowest from entry |
|---|---|---|---|
| 2016 | +14.82% | +19.53% | -1.00% |
| 2017 | +12.33% | +15.02% | -5.34% |
| 2018 | +4.19% | +13.42% | -12.83% |
| 2019 | +21.79% | +24.38% | -2.64% |
| 2020 | +22.40% | +28.59% | -10.00% |
| 2021 | +3.42% | +7.37% | -10.31% |
| 2022 | +15.76% | +17.37% | +0.00% |
| 2023 | +18.38% | +22.86% | -2.91% |
| 2024 | +8.14% | +9.60% | -1.04% |
| 2025 | +17.22% | +17.87% | -4.61% |
Looking further back
Checking persistence, 2006–2025 lowers the median to 11.42% and includes two losses, making the recent consistency less convincing. It reuses all ten selected windows. The ten selected midterm-election years spanning 1986–2022 also favor gains, with eight positive endings. That small sample shares 2018 and 2022 with the primary study, limiting independent confirmation and establishing no election cause.[4]
See the history behind this comparison
TradeWave checks the same seasonal dates across different sets of years. This helps show whether the pattern holds up when you look at another stretch of history.
| History | Observed start years | Direction | Success rate | Median result |
|---|---|---|---|---|
| Article study: 10 consecutive historical windows (2016–2025) | 2016, 2017, 2018, 2019, 2020, 2021, 2022, 2023, 2024, 2025 | long | 100.0% | 15.29% |
| 20 consecutive historical windows (2006–2025) | 2006, 2007, 2008, 2009, 2010, 2011, 2012, 2013, 2014, 2015, 2016, 2017, 2018, 2019, 2020, 2021, 2022, 2023, 2024, 2025 | long | 90.0% | 11.42% |
| 10 selected midterm-election years (1986–2022) | 1986, 1990, 1994, 1998, 2002, 2006, 2010, 2014, 2018, 2022 | long | 80.0% | 14.34% |
Some years appear in more than one group, so agreement is not an independent test. A requested lookback can extend beyond available history; the observed years are listed above. Election-cycle groups use matching phases, not consecutive years. Results follow the direction shown: a positive short result means prices fell. Small samples and different market periods make the comparison less conclusive.
The next business checkpoint
January 15, 2027 brings scheduled fourth-quarter and full-year results: can momentum carry through year-end?[3]
Below, recorded prices end October 19, 2026. The average seasonal path uses this article’s 2016–2025 years, scaled onto the price chart for the next 60 weekdays, October 20–January 11, 2027. That separate horizon illustrates historical shape, not future recorded prices, earnings or a price target. Inspect the same window’s outcomes across histories in TradeWave.[4]
Price history and the seasonal outlook

Explore this exact seasonal window in TradeWave. Compare its win rate and average result across different histories, and inspect how far prices moved above or below their starting point. Account access applies in TradeWave.
About this seasonal analysis
10 consecutive historical windows (2016–2025). The selected dates, years, direction, returns and ranges come from TradeWave. When a window boundary is a weekend or market holiday, TradeWave uses the next available trading session. SMN displays the returned results without recalculating them. A year label identifies the start of the historical window; a window can end in the following calendar year.
Green and red bars show the underlying adjusted-price movement. The range endpoints measure changes from the entry price, not a peak-to-trough loss. Historical results are before trading costs and do not guarantee future performance.