
With 3M’s October 20 earnings in hand, Dow investors face another question: will the next consumer report show continued spending strength as a historically favorable season begins?[1][3][4]
The October 27, 2026–July 21, 2027 window approaches with all 18 selected midterm windows from 1954–2022 finishing higher. Broader histories include losses, however, raising the question of how much confidence investors should place in that favorable seasonal record.[4]
Earnings now, spending next
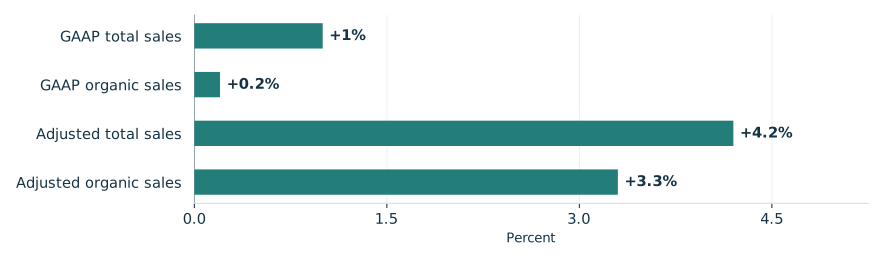
3M’s third-quarter report showed GAAP EPS of $2.63 versus $1.55 a year earlier; adjusted EPS was $2.50 versus $2.23. The sales chart separates GAAP growth from adjusted figures, which exclude manufactured PFAS products. Adjusted earnings now exclude intangible amortization, with both periods presented consistently and no material effect on year-over-year comparisons.[1]
Management highlighted sales and earnings growth alongside continued margin expansion, and attributed its confidence to productivity improvements through structural transformation and a stronger technology pipeline. 3M raised its full-year 2026 adjusted EPS guidance to $9.10–$9.15 on the new accounting basis and forecast adjusted total sales growth above 4.5%, including adjusted organic growth above 3.5%. The outlook incorporates year-to-date performance, the Madison Fire & Rescue acquisition and the amortization change. Comparable forward GAAP measures were not provided because certain items could not be forecast without unreasonable effort.[1]
The October 21 AWS collaboration announcement adds plans to deploy and scale 3M’s optical technology in data centers; deployment remains prospective.[2]
3M’s third-quarter sales growth by reporting basis
Reported year-over-year changes, third quarter 2026

View chart data & download
| Measure | Value | Period | Status |
|---|---|---|---|
| GAAP total sales | +1% | Q3 2026 year over year | reported |
| GAAP organic sales | +0.2% | Q3 2026 year over year | reported |
| Adjusted total sales | +4.2% | Q3 2026 year over year | reported |
| Adjusted organic sales | +3.3% | Q3 2026 year over year | reported |
A strong selected seasonal record
TradeWave’s selected midterm history has a median full-window rise of 18.48%. That describes changes in the Dow’s level: the spot index cannot be bought directly, and these results do not establish attainable returns from investment products. The October 21 observation cannot establish the October 27 starting level, and historical full-window results are not forecasts.[4]
The year-by-year seasonal record

View exact TradeWave observations and download
| Window starting year | Ending price change | Highest from entry | Lowest from entry |
|---|---|---|---|
| 1954 | +29.61% | +32.45% | -1.57% |
| 1958 | +23.64% | +24.91% | -0.76% |
| 1962 | +18.88% | +26.52% | -0.07% |
| 1966 | +12.35% | +13.48% | -4.13% |
| 1970 | +18.08% | +27.00% | -1.03% |
| 1974 | +34.85% | +40.23% | -10.07% |
| 1978 | +2.41% | +9.75% | -3.34% |
| 1982 | +22.16% | +24.33% | -2.27% |
| 1986 | +34.00% | +36.82% | -1.88% |
| 1990 | +23.98% | +24.93% | -0.88% |
| 1994 | +19.78% | +22.50% | -6.10% |
| 1998 | +31.52% | +34.50% | -0.45% |
| 2002 | +8.71% | +11.77% | -11.37% |
| 2006 | +15.33% | +15.98% | -1.25% |
| 2010 | +14.36% | +15.73% | -1.77% |
| 2014 | +6.55% | +9.12% | +0.00% |
| 2018 | +11.16% | +12.09% | -11.17% |
| 2022 | +9.97% | +10.43% | -1.88% |
Explore this exact seasonal window in TradeWave. Compare its win rate and average result across different histories, and inspect how far prices moved above or below their starting point. Account access applies in TradeWave.
Winning periods can hurt
The yearly range chart covers the same seasonal period each year, not whole calendar years. October 27, 2018–July 21, 2019 shows why the ending result alone can understate the difficulty of a period: an 11.16% ending gain accompanied a low 11.17% below the starting level. The highs and lows do not reveal their order or measure a peak-to-trough loss.[4]
What happened inside each seasonal window

View exact TradeWave observations and download
| Window starting year | Ending price change | Highest from entry | Lowest from entry |
|---|---|---|---|
| 1954 | +29.61% | +32.45% | -1.57% |
| 1958 | +23.64% | +24.91% | -0.76% |
| 1962 | +18.88% | +26.52% | -0.07% |
| 1966 | +12.35% | +13.48% | -4.13% |
| 1970 | +18.08% | +27.00% | -1.03% |
| 1974 | +34.85% | +40.23% | -10.07% |
| 1978 | +2.41% | +9.75% | -3.34% |
| 1982 | +22.16% | +24.33% | -2.27% |
| 1986 | +34.00% | +36.82% | -1.88% |
| 1990 | +23.98% | +24.93% | -0.88% |
| 1994 | +19.78% | +22.50% | -6.10% |
| 1998 | +31.52% | +34.50% | -0.45% |
| 2002 | +8.71% | +11.77% | -11.37% |
| 2006 | +15.33% | +15.98% | -1.25% |
| 2010 | +14.36% | +15.73% | -1.77% |
| 2014 | +6.55% | +9.12% | +0.00% |
| 2018 | +11.16% | +12.09% | -11.17% |
| 2022 | +9.97% | +10.43% | -1.88% |
Across all years
Checking across all years tests how much the favorable reading depends on selecting midterms: windows starting in 2016–2025 finished higher 80.0% of the time, versus 85.0% for 2006–2025. Both include losses and reuse selected midterm observations; the shorter history also sits within the longer. These limited, overlapping samples provide no independent confirmation of an election effect.[4]
See the history behind this comparison
TradeWave checks the same seasonal dates across different sets of years. This helps show whether the pattern holds up when you look at another stretch of history.
| History | Observed start years | Direction | Success rate | Median result |
|---|---|---|---|---|
| Article study: 18 selected midterm-election years (1954–2022) | 1954, 1958, 1962, 1966, 1970, 1974, 1978, 1982, 1986, 1990, 1994, 1998, 2002, 2006, 2010, 2014, 2018, 2022 | long | 100.0% | 18.48% |
| 10 consecutive historical windows (2016–2025) | 2016, 2017, 2018, 2019, 2020, 2021, 2022, 2023, 2024, 2025 | long | 80.0% | 9.91% |
| 20 consecutive historical windows (2006–2025) | 2006, 2007, 2008, 2009, 2010, 2011, 2012, 2013, 2014, 2015, 2016, 2017, 2018, 2019, 2020, 2021, 2022, 2023, 2024, 2025 | long | 85.0% | 9.28% |
Some years appear in more than one group, so agreement is not an independent test. A requested lookback can extend beyond available history; the observed years are listed above. Election-cycle groups use matching phases, not consecutive years. Results follow the direction shown: a positive short result means prices fell. Small samples and different market periods make the comparison less conclusive.
Spending and historical shape
BEA’s September spending report arrives October 29. Its September 30 release showed August current-dollar spending up 0.9% monthly, real spending up 0.6% and annual PCE inflation at 3.4%. The next question is whether spending strength continued. In TradeWave, compare this same seasonal window across histories and inspect the range of outcomes.[3][4]
Below, recorded index levels end October 21, 2026. The engine’s seasonal overlay uses this article’s 18 selected midterm years to illustrate historical shape over the next 60 weekdays, October 22, 2026–January 13, 2027. This shorter horizon is separate from the full seasonal window; the future overlay dates are a historical illustration, not recorded levels, a prediction or a price target.[4]
Price history and the seasonal outlook

Explore this exact seasonal window in TradeWave. Compare its win rate and average result across different histories, and inspect how far prices moved above or below their starting point. Account access applies in TradeWave.
About this seasonal analysis
18 selected midterm-election years (1954–2022). The selected dates, years, direction, returns and ranges come from TradeWave. When a window boundary is a weekend or market holiday, TradeWave uses the next available trading session. SMN displays the returned results without recalculating them. A year label identifies the start of the historical window; a window can end in the following calendar year.
Green and red bars show the underlying adjusted-price movement. The range endpoints measure changes from the entry price, not a peak-to-trough loss. Historical results are before trading costs and do not guarantee future performance.
Sources & methodology
- 3M Reports Third-Quarter 2026 Results; Raises Full-Year EPS Guidance · 2026-10-20
- 3M and AWS collaborate to advance optical connectivity innovation · 2026-10-21
- Personal Income and Outlays, August 2026 · 2026-09-30
- TradeWave DJI seasonal evidence · 2026-10-22