
Investors in Invesco QQQ Trust, an exchange-traded fund offering Nasdaq-100 exposure, face a timely question: how much confidence does seasonal history warrant as Microsoft prepares to report on October 28, after the close?[3][4]
The approaching October 25, 2026–April 26, 2027 window gained in all six selected historical midterm years from 2002–2022, although broader histories include losses. That favorable record makes the period worth examining before earnings arrive, while leaving open how reliably six observations can guide investors.[5][4]
Different earnings signals
Invesco’s October 6 discussion flags the Nasdaq-100’s reliance on a small group of large companies for performance and index weight, making individual business results relevant to the fund’s broader outlook.[3]
Tesla’s October 22 filing reported Q3 2026 revenue of $28.046 billion versus $28.095 billion a year earlier, and operating income of $718 million versus $1.624 billion. Automotive and energy revenue declined; services rose. Tesla reversed $475 million of automotive regulatory-credit revenue for contractual return of previously delivered credits.[1]
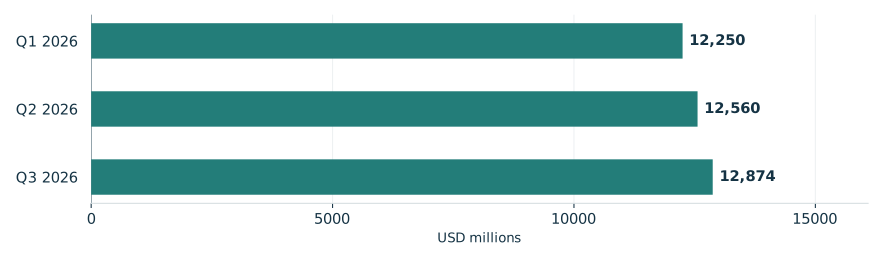
Netflix’s October 20 letter reported Q3 2026 revenue of $12.874 billion, up 11.8%, driven primarily by subscription revenue reflecting memberships and pricing, alongside advertising growth and favorable currency effects. Its 34.6% operating margin, versus 28.2% a year earlier, exceeded forecast primarily through expense timing and slight revenue upside.[2]
Netflix reported quarterly revenue rose through 2026's third quarter
Reported revenue for completed 2026 quarters

View chart data & download
| Measure | Value | Period | Status |
|---|---|---|---|
| Q1 2026 | 12,250 | Q1 2026 | reported |
| Q2 2026 | 12,560 | Q2 2026 | reported |
| Q3 2026 | 12,874 | Q3 2026 | reported |
Six favorable midterm windows
TradeWave’s selected seasonal record puts the median full-window gain at 11.61%. Six observations offer a favorable historical reference, but cannot establish an election-driven effect or an expected return. The window has yet to begin: October 22 observations do not establish its starting conditions.[5]
The year-by-year seasonal record

View exact TradeWave observations and download
| Window starting year | Ending price change | Highest from entry | Lowest from entry |
|---|---|---|---|
| 2002 | +11.25% | +16.56% | -5.59% |
| 2006 | +9.91% | +10.15% | -1.93% |
| 2010 | +13.74% | +14.15% | -2.00% |
| 2014 | +12.40% | +13.32% | +0.00% |
| 2018 | +11.97% | +12.31% | -15.89% |
| 2022 | +10.17% | +13.61% | -8.84% |
Explore this exact seasonal window in TradeWave. Compare its win rate and average result across different histories, and inspect how far prices moved above or below their starting point. Account access applies in TradeWave.
Positive endings can hide steep declines
The yearly range chart shows each year’s same seasonal period, not its whole calendar year. October 25, 2018–April 26, 2019 is useful because QQQ ended up 11.97%, yet traded 15.89% below the starting price. A favorable ending therefore says little about the discomfort endured. The highs and lows do not reveal their order or measure peak-to-trough loss.[5]
What happened inside each seasonal window

View exact TradeWave observations and download
| Window starting year | Ending price change | Highest from entry | Lowest from entry |
|---|---|---|---|
| 2002 | +11.25% | +16.56% | -5.59% |
| 2006 | +9.91% | +10.15% | -1.93% |
| 2010 | +13.74% | +14.15% | -2.00% |
| 2014 | +12.40% | +13.32% | +0.00% |
| 2018 | +11.97% | +12.31% | -15.89% |
| 2022 | +10.17% | +13.61% | -8.84% |
Broader histories include losses
Checking across all years tests whether gains extend beyond the small midterm sample. Both 2016–2025 and 2006–2025 recorded 80.0% profitable windows, tempering confidence in an unbroken pattern. The shorter history reuses 2018 and 2022; the longer reuses every selected midterm year except 2002 and contains the shorter history, so their agreement is not independent confirmation.[5]
See the history behind this comparison
TradeWave checks the same seasonal dates across different sets of years. This helps show whether the pattern holds up when you look at another stretch of history.
| History | Observed start years | Direction | Success rate | Median result |
|---|---|---|---|---|
| Article study: 6 selected midterm-election years (2002–2022) | 2002, 2006, 2010, 2014, 2018, 2022 | long | 100.0% | 11.61% |
| 10 consecutive historical windows (2016–2025) | 2016, 2017, 2018, 2019, 2020, 2021, 2022, 2023, 2024, 2025 | long | 80.0% | 10.47% |
| 20 consecutive historical windows (2006–2025) | 2006, 2007, 2008, 2009, 2010, 2011, 2012, 2013, 2014, 2015, 2016, 2017, 2018, 2019, 2020, 2021, 2022, 2023, 2024, 2025 | long | 80.0% | 10.47% |
Some years appear in more than one group, so agreement is not an independent test. A requested lookback can extend beyond available history; the observed years are listed above. Election-cycle groups use matching phases, not consecutive years. Results follow the direction shown: a positive short result means prices fell. Small samples and different market periods make the comparison less conclusive.
Forecasts and the next earnings release
Netflix forecasts Q4 2026 revenue of $13.442 billion, up 11.5%, and a 26.0% operating margin versus 24.5% in Q4 2025. That margin forecast includes an expected negative impact of about 120 basis points associated with headcount reductions.[2]
Its full-year revenue forecast is $51.1 billion, up 13% but 0.2% below the prior forecast range’s midpoint. Subscription revenue growth exceeded expectations, while slower-than-expected rollout of some advertising capabilities reduced expected 2026 ad revenue to about $2.7 billion from about $3 billion.[2]
Netflix forecasts a 31.5% operating margin for 2026, or 31.4% using January 1, 2026 exchange rates, versus 29.5% in 2025. The updated full-year margin guidance includes about 30 basis points of expected negative impact from Q4 headcount reductions.[2]
Price history and the seasonal outlook

Explore this exact seasonal window in TradeWave. Compare its win rate and average result across different histories, and inspect how far prices moved above or below their starting point. Account access applies in TradeWave.
About this seasonal analysis
6 selected midterm-election years (2002–2022). The selected dates, years, direction, returns and ranges come from TradeWave. When a window boundary is a weekend or market holiday, TradeWave uses the next available trading session. SMN displays the returned results without recalculating them. A year label identifies the start of the historical window; a window can end in the following calendar year.
Green and red bars show the underlying adjusted-price movement. The range endpoints measure changes from the entry price, not a peak-to-trough loss. Historical results are before trading costs and do not guarantee future performance.
Sources & methodology
- TESLA, INC. FORM 10-Q FOR THE QUARTER ENDED SEPTEMBER 30, 2026 · 2026-10-22
- Letter to Shareholders · 2026-10-20
- Building versatile portfolios with the QQQ Innovation Suite · 2026-10-06
- Microsoft announces quarterly earnings release date · 2026-10-07
- TradeWave QQQ seasonal evidence · 2026-10-23