
Gold futures (GC) readers weighing November exposure face a practical question: how much weight should history carry with today's Fed meeting still unresolved?[3][1]
TradeWave's November 12–May 14 seasonal window finished higher in all six selected midterm years from 2002–2022, although broader histories include losses. That favorable record makes the approaching window worth examining alongside the economic news before entry.[3]
Inflation before entry
The World Gold Council's October 26 monitor described elevated geopolitical and market risks, lower Treasury yields and a softer dollar. It attributed falling yields to rotation into Treasuries amid weak AI-related stocks, rather than easing inflation expectations.[1]
Markets assigned less than a 10% probability of another hike. The Council flagged the October 28 Fed meeting and October 29 releases as tests: expected PCE inflation of 3.6% and GDP growth rising from 2.2% to 3.2%. These were expectations; the saved evidence establishes no subsequent outcomes.[1]
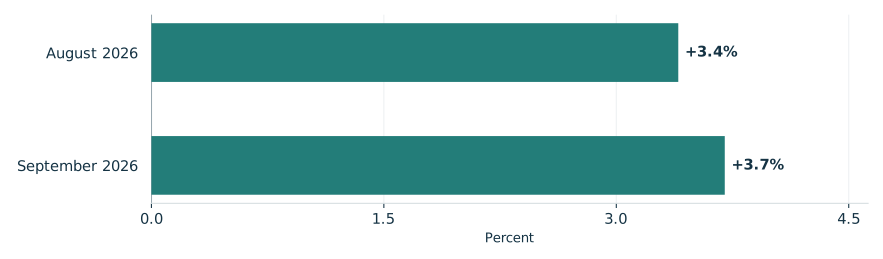
BLS reported on October 14 that September headline CPI rose 3.7% over 12 months, versus August's 3.4%; core CPI rose 2.6%. October CPI is scheduled for November 10, two days before entry.[2]
Reported headline inflation rose
U.S. all-items CPI, 12-month change

View chart data & download
| Measure | Value | Period | Status |
|---|---|---|---|
| August 2026 | +3.4% | 12 months ending August 2026 | reported |
| September 2026 | +3.7% | 12 months ending September 2026 | reported |
Six favorable midterm windows
TradeWave's selected seasonal record gives a median full-window long result of 8.17%, before trading costs. These are six separate midterm observations, not consecutive years. The proposed November 12, 2026–May 14, 2027 window has yet to begin.[3]
The year-by-year seasonal record

View exact TradeWave observations and download
| Window starting year | Ending price change | Highest from entry | Lowest from entry |
|---|---|---|---|
| 2002 | +8.57% | +19.85% | -2.77% |
| 2006 | +7.10% | +10.94% | -3.09% |
| 2010 | +9.15% | +15.47% | -4.23% |
| 2014 | +5.74% | +12.48% | -1.48% |
| 2018 | +7.77% | +11.88% | -0.42% |
| 2022 | +13.78% | +16.82% | -2.11% |
Explore this exact seasonal window in TradeWave. Compare its win rate and average result across different histories, and inspect how far prices moved above or below their starting point. Account access applies in TradeWave.
What a winning finish conceals
The yearly range chart covers the same seasonal period each year, not whole calendar years. November 12, 2010–May 14, 2011 is useful because its 9.15% ending gain accompanied a move 4.23% below the starting price. Highs and lows reveal discomfort hidden by the finish, without establishing their order or a peak-to-trough drawdown.[3]
What happened inside each seasonal window

View exact TradeWave observations and download
| Window starting year | Ending price change | Highest from entry | Lowest from entry |
|---|---|---|---|
| 2002 | +8.57% | +19.85% | -2.77% |
| 2006 | +7.10% | +10.94% | -3.09% |
| 2010 | +9.15% | +15.47% | -4.23% |
| 2014 | +5.74% | +12.48% | -1.48% |
| 2018 | +7.77% | +11.88% | -0.42% |
| 2022 | +13.78% | +16.82% | -2.11% |
Broader histories include losses
Checking across all years tempers the perfect midterm record: both 2016–2025 and 2006–2025 had 80.0% profitable windows. Their medians were 9.52% and 7.58%, respectively, making the result less strong further back. The shorter history reuses 2018 and 2022; the longer reuses every selected midterm except 2002. Agreement therefore provides limited independent confirmation of a small selected sample.[3]
See the history behind this comparison
TradeWave checks the same seasonal dates across different sets of years. This helps show whether the pattern holds up when you look at another stretch of history.
| History | Observed start years | Direction | Success rate | Median result |
|---|---|---|---|---|
| Article study: 6 selected midterm-election years (2002–2022) | 2002, 2006, 2010, 2014, 2018, 2022 | long | 100.0% | 8.17% |
| 10 consecutive historical windows (2016–2025) | 2016, 2017, 2018, 2019, 2020, 2021, 2022, 2023, 2024, 2025 | long | 80.0% | 9.52% |
| 20 consecutive historical windows (2006–2025) | 2006, 2007, 2008, 2009, 2010, 2011, 2012, 2013, 2014, 2015, 2016, 2017, 2018, 2019, 2020, 2021, 2022, 2023, 2024, 2025 | long | 80.0% | 7.58% |
Some years appear in more than one group, so agreement is not an independent test. A requested lookback can extend beyond available history; the observed years are listed above. Election-cycle groups use matching phases, not consecutive years. Results follow the direction shown: a positive short result means prices fell. Small samples and different market periods make the comparison less conclusive.
Revisit the evidence before November
October 27 observations cannot establish November 12 conditions. Inspect the same window's outcomes in TradeWave as policy and inflation results arrive. Below, recorded prices end October 27, 2026. The engine's seasonal overlay uses this article's six selected years over the next 60 weekdays, October 28–January 19, 2027. That separate, shorter horizon illustrates historical shape, not future prices or a target.[3]
Price history and the seasonal outlook

Explore this exact seasonal window in TradeWave. Compare its win rate and average result across different histories, and inspect how far prices moved above or below their starting point. Account access applies in TradeWave.
About this seasonal analysis
6 selected midterm-election years (2002–2022). The selected dates, years, direction, returns and ranges come from TradeWave. When a window boundary is a weekend or market holiday, TradeWave uses the next available trading session. SMN displays the returned results without recalculating them. A year label identifies the start of the historical window; a window can end in the following calendar year.
Green and red bars show the underlying adjusted-price movement. The range endpoints measure changes from the entry price, not a peak-to-trough loss. Historical results are before trading costs and do not guarantee future performance.
Sources & methodology
- Weekly Markets Monitor - Chill and boom · 2026-10-26
- Consumer Price Index News Release - 2026 M09 Results · 2026-10-14
- TradeWave GC seasonal evidence · 2026-10-28