
eBay’s October 28 results showed growing sales but thinner operating margins. With job cuts planned, shareholders face a harder question: can that momentum translate into stronger profitability?[1][2]
The approaching November 1, 2026–February 19, 2027 seasonal window puts that question alongside gains in all six selected historical midterm-election windows. Broader histories were less consistent. How much confidence should investors place in this favorable stretch while assessing the business?[4]
Growth alongside thinner margins
Q3 revenue reached $3.2 billion, up 14% as reported and 13% currency-neutral; gross merchandise volume (GMV) reached $23.2 billion, up 15% and 16%, respectively. Management credited Focus Categories, consumer-to-consumer commerce, recommerce and product initiatives.[1]
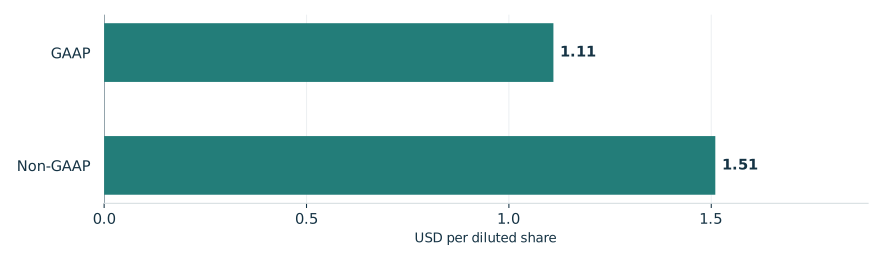
Yet GAAP operating margin fell to 19.2% from 20.3% in Q3 2025; non-GAAP margin fell to 26.3% from 27.0%. The accompanying graphic separates reported earnings per share under the two accounting bases.[1]
The October 28 guidance for continuing operations includes expected Depop impacts. For Q4 2026, eBay forecasts revenue of $3.19 billion–$3.24 billion and GMV of $23.7 billion–$24.1 billion, with currency-neutral year-over-year growth of 7%–9% and 12%–14%, respectively. Diluted EPS guidance is $0.82–$0.87 GAAP and $1.48–$1.53 non-GAAP.[1]
eBay’s reported third-quarter earnings per share
Continuing operations, third quarter ended September 30, 2026

View chart data & download
| Measure | Value | Period | Status |
|---|---|---|---|
| GAAP | 1.11 | Q3 2026 | reported |
| Non-GAAP | 1.51 | Q3 2026 | reported |
Six selected midterm windows
TradeWave’s study follows six selected midterm-election start years from 2002 through 2022. Its 16.72% median full-window gain describes completed periods before costs. Six observations cannot establish an election effect or a dependable probability of gains.[4]
The year-by-year seasonal record

View exact TradeWave observations and download
| Window starting year | Ending price change | Highest from entry | Lowest from entry |
|---|---|---|---|
| 2002 | +18.83% | +21.62% | -4.69% |
| 2006 | +6.40% | +8.37% | -9.00% |
| 2010 | +14.61% | +20.40% | -7.29% |
| 2014 | +9.39% | +9.94% | -0.65% |
| 2018 | +25.51% | +25.78% | -11.89% |
| 2022 | +20.90% | +31.86% | -4.52% |
Explore this exact seasonal window in TradeWave. Compare its win rate and average result across different histories, and inspect how far prices moved above or below their starting point. Account access applies in TradeWave.
What a winning finish can conceal
The yearly range chart covers the same seasonal period each year, not whole calendar years. November 1, 2018–February 19, 2019 is useful because its 25.51% ending gain coexisted with a low 11.89% below the starting price. The highs and lows show movement endured, without establishing their order or a peak-to-trough drawdown.[4]
The October 20 restructuring targets roughly 9% of jobs to align resources with strategic priorities. Expected GAAP pretax charges of $130 million–$150 million, mainly severance and benefits, fall mostly in Q4 2026; the full amount entails future cash spending. Substantial completion is expected by Q1 2027’s end, subject to local law, consultation and business needs. Savings would fund strategic and operating initiatives; costs and benefits could differ from expectations.[2]
What happened inside each seasonal window

View exact TradeWave observations and download
| Window starting year | Ending price change | Highest from entry | Lowest from entry |
|---|---|---|---|
| 2002 | +18.83% | +21.62% | -4.69% |
| 2006 | +6.40% | +8.37% | -9.00% |
| 2010 | +14.61% | +20.40% | -7.29% |
| 2014 | +9.39% | +9.94% | -0.65% |
| 2018 | +25.51% | +25.78% | -11.89% |
| 2022 | +20.90% | +31.86% | -4.52% |
Looking across all years
Broader histories test how much the selected years shape the result. The same window’s median was 17.55% for starts in 2016–2025 versus 11.34% in 2006–2025, favorable but less convincing further back. Agreement adds limited independent reassurance: the shorter history reuses 2018 and 2022; the longer reuses every selected midterm year except 2002 and contains the entire shorter history.[4]
See the history behind this comparison
TradeWave checks the same seasonal dates across different sets of years. This helps show whether the pattern holds up when you look at another stretch of history.
| History | Observed start years | Direction | Success rate | Median result |
|---|---|---|---|---|
| Article study: 6 selected midterm-election years (2002–2022) | 2002, 2006, 2010, 2014, 2018, 2022 | long | 100.0% | 16.72% |
| 10 consecutive historical windows (2016–2025) | 2016, 2017, 2018, 2019, 2020, 2021, 2022, 2023, 2024, 2025 | long | 90.0% | 17.55% |
| 20 consecutive historical windows (2006–2025) | 2006, 2007, 2008, 2009, 2010, 2011, 2012, 2013, 2014, 2015, 2016, 2017, 2018, 2019, 2020, 2021, 2022, 2023, 2024, 2025 | long | 80.0% | 11.34% |
Some years appear in more than one group, so agreement is not an independent test. A requested lookback can extend beyond available history; the observed years are listed above. Election-cycle groups use matching phases, not consecutive years. Results follow the direction shown: a positive short result means prices fell. Small samples and different market periods make the comparison less conclusive.
From November entry to Q4 delivery
For full-year 2026, the same continuing-operations outlook projects revenue of $12.62 billion–$12.67 billion, with 12%–13% currency-neutral year-over-year growth, and GMV of $91.5 billion–$91.9 billion, with 14% growth on that basis at both ends of the range. Diluted EPS guidance is $4.26–$4.31 GAAP and $6.25–$6.30 non-GAAP. These forecasts also include expected Depop impacts.[1]
The Depop acquisition closed July 30, 2026.[3]
The next business question is whether Q4 delivery can sustain growth and improve profitability as restructuring proceeds.[1][2]
Price history and the seasonal outlook

Explore this exact seasonal window in TradeWave. Compare its win rate and average result across different histories, and inspect how far prices moved above or below their starting point. Account access applies in TradeWave.
About this seasonal analysis
6 selected midterm-election years (2002–2022). The selected dates, years, direction, returns and ranges come from TradeWave. When a window boundary is a weekend or market holiday, TradeWave uses the next available trading session. SMN displays the returned results without recalculating them. A year label identifies the start of the historical window; a window can end in the following calendar year.
Green and red bars show the underlying adjusted-price movement. The range endpoints measure changes from the entry price, not a peak-to-trough loss. Historical results are before trading costs and do not guarantee future performance.
Sources & methodology
- eBay Inc. Reports Third Quarter 2026 Results · 2026-10-28
- Form 8-K — Current Report · 2026-10-22
- eBay Completes Acquisition of Depop · 2026-07-30
- TradeWave EBAY seasonal evidence · 2026-10-29