Can NVIDIA sustain its AI sales momentum? Investors await the November 17 results call as a favorable seasonal window opens.[4][5]
The nine-day October 30–November 7 window gained in all six selected midterm-election years spanning 2002–2022. That raises a timing question before the report: how much confidence does this small record deserve?[5]
The sales and margin benchmarks
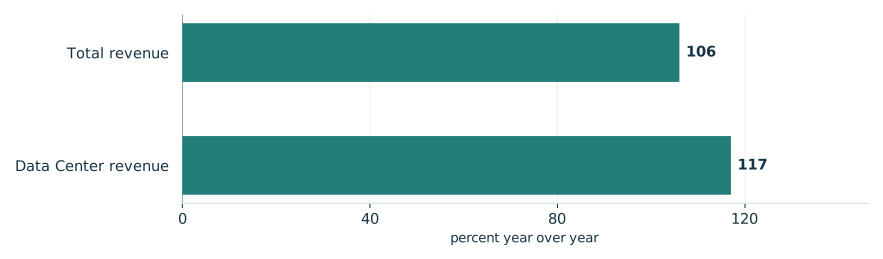
For the quarter ended July 26, 2026, revenue reached $96.2 billion versus $46.743 billion a year earlier, up 106% annually and 18% sequentially. August 26 commentary attributed Data Center revenue of $89.0 billion, up 117%, to the Blackwell Ultra ramp. Edge Computing grew, with strong workstation sales partly offset by slower consumer PC sales amid elevated memory and systems prices. Supply and capacity commitments rose from $119 billion to $279 billion, primarily for memory.[1]
Third-quarter guidance was $108.0 billion revenue, plus or minus 2%, assuming no China Data Center compute revenue. Both GAAP and non-GAAP gross margins were forecast at 74.0%, plus or minus 50 basis points; respective operating expenses were approximately $9.2 billion and $9.0 billion.[1]
That quarter ended October 25 and remained unreported; the October 28 notice confirmed the November 17 call.[4]
NVIDIA’s reported second-quarter growth
Fiscal 2027 second quarter versus a year earlier

View chart data & download
| Measure | Value | Period | Status |
|---|---|---|---|
| Total revenue | 106 | Q2 FY2027 | reported |
| Data Center revenue | 117 | Q2 FY2027 | reported |
Six favorable midterm windows
TradeWave’s selected seasonal record has a 5.61% median full-window long result. Six observations offer historical perspective, not reliable odds. The October 29 observation also cannot establish conditions at October 30 entry.[5]
The year-by-year seasonal record

View exact TradeWave observations and download
| Window starting year | Ending price change | Highest from entry | Lowest from entry |
|---|---|---|---|
| 2002 | +29.37% | +46.83% | +0.00% |
| 2006 | +4.06% | +6.40% | -3.82% |
| 2010 | +5.12% | +6.05% | -0.17% |
| 2014 | +5.90% | +10.69% | +0.00% |
| 2018 | +5.32% | +9.36% | +0.00% |
| 2022 | +5.96% | +6.78% | -4.01% |
Explore this exact seasonal window in TradeWave. Compare its win rate and average result across different histories, and inspect how far prices moved above or below their starting point. Account access applies in TradeWave.
A gain can include a decline
The yearly range chart covers the same seasonal period each year. The latest selected example, October 30–November 7, 2022, illustrates the distinction: it ended up 5.96% but traded 4.01% below the starting price. These highs and lows reveal movement endured, without establishing their order, peak-to-trough drawdown or future limits.[5]
What happened inside each seasonal window

View exact TradeWave observations and download
| Window starting year | Ending price change | Highest from entry | Lowest from entry |
|---|---|---|---|
| 2002 | +29.37% | +46.83% | +0.00% |
| 2006 | +4.06% | +6.40% | -3.82% |
| 2010 | +5.12% | +6.05% | -0.17% |
| 2014 | +5.90% | +10.69% | +0.00% |
| 2018 | +5.32% | +9.36% | +0.00% |
| 2022 | +5.96% | +6.78% | -4.01% |
Broader histories include losses
Checking across all years tests whether the favorable reading extends beyond midterms: success rates were 90.0% for 2016–2025 and 85.0% for 2006–2025. Losses weaken the perfect-record impression. The shorter history reuses 2018 and 2022; the longer reuses every selected year except 2002. Agreement therefore provides limited independent confirmation and cannot establish an election effect.[5]
See the history behind this comparison
TradeWave checks the same seasonal dates across different sets of years. This helps show whether the pattern holds up when you look at another stretch of history.
| History | Observed start years | Direction | Success rate | Median result |
|---|---|---|---|---|
| Article study: 6 selected midterm-election years (2002–2022) | 2002, 2006, 2010, 2014, 2018, 2022 | long | 100.0% | 5.61% |
| 10 consecutive historical windows (2016–2025) | 2016, 2017, 2018, 2019, 2020, 2021, 2022, 2023, 2024, 2025 | long | 90.0% | 5.64% |
| 20 consecutive historical windows (2006–2025) | 2006, 2007, 2008, 2009, 2010, 2011, 2012, 2013, 2014, 2015, 2016, 2017, 2018, 2019, 2020, 2021, 2022, 2023, 2024, 2025 | long | 85.0% | 5.2% |
Some years appear in more than one group, so agreement is not an independent test. A requested lookback can extend beyond available history; the observed years are listed above. Election-cycle groups use matching phases, not consecutive years. Results follow the direction shown: a positive short result means prices fell. Small samples and different market periods make the comparison less conclusive.
Inspect the historical shape
The price chart below overlays the engine’s normalized seasonal path from these six selected midterm years on actual prices recorded through October 29, 2026. Its next 60 weekdays, October 30, 2026–January 21, 2027, are a separate illustration horizon from the nine-day study, not future recorded prices, an earnings prediction or a price target. Ahead of the report, inspect this same window’s outcomes across histories in TradeWave.[5]
Price history and the seasonal outlook

Explore this exact seasonal window in TradeWave. Compare its win rate and average result across different histories, and inspect how far prices moved above or below their starting point. Account access applies in TradeWave.
About this seasonal analysis
6 selected midterm-election years (2002–2022). The selected dates, years, direction, returns and ranges come from TradeWave. When a window boundary is a weekend or market holiday, TradeWave uses the next available trading session. SMN displays the returned results without recalculating them. A year label identifies the start of the historical window; a window can end in the following calendar year.
Green and red bars show the underlying adjusted-price movement. The range endpoints measure changes from the entry price, not a peak-to-trough loss. Historical results are before trading costs and do not guarantee future performance.
Sources & methodology
- CFO Commentary on Second Quarter Fiscal 2027 Results · 2026-08-26
- Form 10-Q · 2026-08-26
- NVIDIA and Oracle Expand NVIDIA Vera Rubin to Multi-Gigawatt Scale and Bring NVIDIA Vera CPU to Oracle Cloud Infrastructure · 2026-10-27
- NVIDIA Sets Conference Call for Third-Quarter Financial Results · 2026-10-28
- TradeWave NVDA seasonal evidence · 2026-10-30