
Can AMD’s AI deployment sustain sales growth as its seasonal window begins? In its October 6 announcement, AMD scheduled third-quarter results for after the market close on November 3, 2026, later on this edition’s date.[2][3][4]
The November 3, 2026–August 12, 2027 window begins today. The same seasonal period produced gains in nine of ten completed windows starting in 2016–2025, but only 65.0% were profitable across 2006–2025. How much weight should investors put on the stronger recent record?[4]
The business benchmarks
AMD’s August 4 results covered the quarter ended June 27, 2026: revenue reached $11.5 billion, up 50% year over year. Data Center supplied 58% of sales.[1]
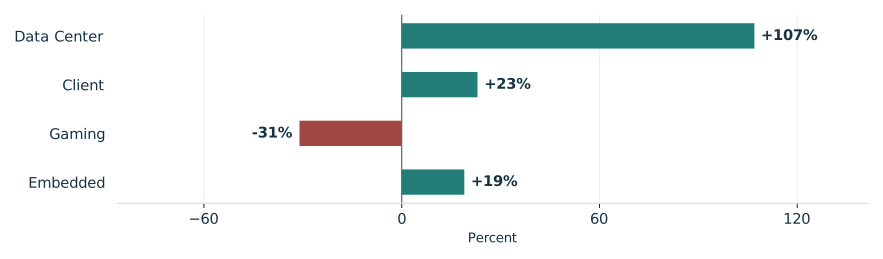
Data Center revenue rose 107% to $6.7 billion on EPYC processor and Instinct GPU demand. Client strength offset Gaming weakness, which AMD attributed to lower semi-custom revenue.[1]
August guidance provides the third-quarter benchmark: $12.7–$13.3 billion revenue, approximately 41% year-over-year growth at the midpoint and approximately 56% non-GAAP gross margin. These were forecasts. AMD said reconciliation to GAAP was impracticable because the necessary adjustments depended on uncertain future events.[1]
AMD’s second-quarter segment growth was uneven
Reported year-over-year revenue changes, second quarter 2026

View chart data & download
| Measure | Value | Period | Status |
|---|---|---|---|
| Data Center | +107% | Q2 2026 year over year | reported |
| Client | +23% | Q2 2026 year over year | reported |
| Gaming | -31% | Q2 2026 year over year | reported |
| Embedded | +19% | Q2 2026 year over year | reported |
Strong recent results, weaker longer history
TradeWave’s selected seasonal record shows a 70.2% median full-window long result, versus 31.7% across 2006–2025. Looking further back tests whether the recent strength persists across eras. It becomes less convincing, and the longer sample includes every selected observation, so it offers no independent confirmation.[4]
The year-by-year seasonal record

View exact TradeWave observations and download
| Window starting year | Ending price change | Highest from entry | Lowest from entry |
|---|---|---|---|
| 2016 | +90.45% | +133.58% | -7.16% |
| 2017 | +77.43% | +81.47% | -18.71% |
| 2018 | +62.96% | +78.64% | -19.45% |
| 2019 | +127.64% | +140.53% | -2.12% |
| 2020 | +39.07% | +59.95% | -5.33% |
| 2021 | -22.75% | +25.99% | -45.15% |
| 2022 | +86.29% | +120.98% | -0.52% |
| 2023 | +21.84% | +102.49% | -1.81% |
| 2024 | +24.33% | +29.70% | -45.65% |
| 2025 | +85.99% | +125.20% | -27.51% |
Explore this exact seasonal window in TradeWave. Compare its win rate and average result across different histories, and inspect how far prices moved above or below their starting point. Account access applies in TradeWave.
A winning finish can conceal a deep fall
The yearly range chart shows each year’s same seasonal period, not its whole calendar year. November 3, 2024–August 12, 2025 is useful because its 24.33% ending gain coexisted with a low 45.65% below the starting price. Highs and lows reveal what the ending return hides, without establishing their order, a peak-to-trough loss or a future path.[4]
What happened inside each seasonal window

View exact TradeWave observations and download
| Window starting year | Ending price change | Highest from entry | Lowest from entry |
|---|---|---|---|
| 2016 | +90.45% | +133.58% | -7.16% |
| 2017 | +77.43% | +81.47% | -18.71% |
| 2018 | +62.96% | +78.64% | -19.45% |
| 2019 | +127.64% | +140.53% | -2.12% |
| 2020 | +39.07% | +59.95% | -5.33% |
| 2021 | -22.75% | +25.99% | -45.15% |
| 2022 | +86.29% | +120.98% | -0.52% |
| 2023 | +21.84% | +102.49% | -1.81% |
| 2024 | +24.33% | +29.70% | -45.65% |
| 2025 | +85.99% | +125.20% | -27.51% |
Midterm history tempers confidence
Checking the election phase also weakens the favorable reading: 60.0% of ten selected midterm-year windows spanning 1986–2022 were profitable. That small, widely spaced sample cannot establish an election effect. It reuses 2018 and 2022 from the primary study, limiting independent confirmation.[4]
See the history behind this comparison
TradeWave checks the same seasonal dates across different sets of years. This helps show whether the pattern holds up when you look at another stretch of history.
| History | Observed start years | Direction | Success rate | Median result |
|---|---|---|---|---|
| Article study: 10 consecutive historical windows (2016–2025) | 2016, 2017, 2018, 2019, 2020, 2021, 2022, 2023, 2024, 2025 | long | 90.0% | 70.2% |
| 20 consecutive historical windows (2006–2025) | 2006, 2007, 2008, 2009, 2010, 2011, 2012, 2013, 2014, 2015, 2016, 2017, 2018, 2019, 2020, 2021, 2022, 2023, 2024, 2025 | long | 65.0% | 31.7% |
| 10 selected midterm-election years (1986–2022) | 1986, 1990, 1994, 1998, 2002, 2006, 2010, 2014, 2018, 2022 | long | 60.0% | 20.4% |
Some years appear in more than one group, so agreement is not an independent test. A requested lookback can extend beyond available history; the observed years are listed above. Election-cycle groups use matching phases, not consecutive years. Results follow the direction shown: a positive short result means prices fell. Small samples and different market periods make the comparison less conclusive.
Deployment progress and the shorter illustration
On October 27, 2026, AMD said initial Helios systems were installed and being tested at Meta; broader deployment remained prospective.[2]
The November 3, 2026 results and scheduled 5 p.m. ET call are the next opportunity to assess growth and hear whether deployment has progressed.[3][2]
Below, recorded prices end November 2, 2026, before entry. The engine’s seasonal overlay scales historical shape from this article’s selected 2016–2025 windows onto the price chart for the next 60 weekdays, November 3, 2026–January 25, 2027. That horizon is shorter than the full seasonal window and illustrates history, not future recorded prices, an earnings prediction or a price target. Inspect the full-window outcomes and yearly ranges in TradeWave, and compare this same window across histories.[4]
Price history and the seasonal outlook

Explore this exact seasonal window in TradeWave. Compare its win rate and average result across different histories, and inspect how far prices moved above or below their starting point. Account access applies in TradeWave.
About this seasonal analysis
10 consecutive historical windows (2016–2025). The selected dates, years, direction, returns and ranges come from TradeWave. When a window boundary is a weekend or market holiday, TradeWave uses the next available trading session. SMN displays the returned results without recalculating them. A year label identifies the start of the historical window; a window can end in the following calendar year.
Green and red bars show the underlying adjusted-price movement. The range endpoints measure changes from the entry price, not a peak-to-trough loss. Historical results are before trading costs and do not guarantee future performance.