
Investors weighing the S&P 500’s November seasonal opportunity face a practical question: how much confidence does history deserve as the index’s membership changes? S&P Dow Jones Indices’ October 30 notice schedules Okta to replace Kenvue before the November 4, 2026 open. Kimberly-Clark’s acquisition of Kenvue remained subject to final closing conditions; the notice does not confirm completion.[3][2]
The selected seasonal record is favorable: all 15 midterm-year windows from November 11 through July 22 of the following year finished higher. Broader comparisons across all years include losses. With the 2026 window still ahead, the question is whether that selected history offers enough reassurance about both the ending result and the declines investors might face along the way.[3]
Alphabet’s growth and cash demands
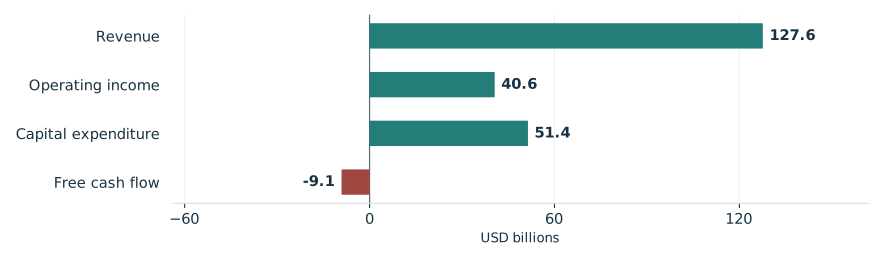
Alphabet’s October 28 call reported third-quarter 2026 revenue of $127.6 billion, up 25% year over year; Cloud revenue grew 103%. Yet net income and earnings per share fell because other income and expenses declined, primarily from an unrealized SpaceX investment loss.[1]
Capital expenditure of $51.4 billion drove negative $9.1 billion free cash flow, also affected by TPU-system inventory buildup and an EC fine payment. The captured transcript ends before management’s promised fourth-quarter and full-year outlook, so it cannot establish those forecasts.[1]
Alphabet’s reported third-quarter scale and cash flow
Third quarter 2026; USD billions

View chart data & download
| Measure | Value | Period | Status |
|---|---|---|---|
| Revenue | 127.6 | Q3 2026 | reported |
| Operating income | 40.6 | Q3 2026 | reported |
| Capital expenditure | 51.4 | Q3 2026 | reported |
| Free cash flow | -9.1 | Q3 2026 | reported |
What the midterm record offers
TradeWave’s selected midterm years span 1966–2022, with a median full-window rise of 14.39%. The engine defines this edition’s analysis window as November 11, 2026–July 22, 2027. The historical results cover that complete seasonal period, not a return available from today. They describe changes in the index level: SPX cannot be invested in directly, and these figures do not establish attainable profits in futures, options or exchange-traded products.[3]
The year-by-year seasonal record

View exact TradeWave observations and download
| Window starting year | Ending price change | Highest from entry | Lowest from entry |
|---|---|---|---|
| 1966 | +14.39% | +16.24% | -3.72% |
| 1970 | +16.56% | +24.19% | -3.29% |
| 1974 | +21.69% | +28.52% | -14.66% |
| 1978 | +9.08% | +12.93% | -1.46% |
| 1982 | +19.15% | +21.06% | -6.25% |
| 1986 | +24.85% | +27.32% | -4.68% |
| 1990 | +19.84% | +22.47% | -3.17% |
| 1994 | +20.39% | +21.76% | -4.21% |
| 1998 | +21.41% | +26.71% | -0.48% |
| 2002 | +12.77% | +15.89% | -9.96% |
| 2006 | +11.35% | +12.39% | -1.48% |
| 2010 | +10.83% | +12.94% | -3.34% |
| 2014 | +3.65% | +4.66% | -3.29% |
| 2018 | +9.49% | +10.70% | -13.93% |
| 2022 | +14.07% | +14.66% | -5.72% |
Explore this exact seasonal window in TradeWave. Compare its win rate and average result across different histories, and inspect how far prices moved above or below their starting point. Account access applies in TradeWave.
A positive finish can conceal losses
The yearly range chart shows the same seasonal period for each year, not the whole calendar year. November 11, 2018–July 22, 2019 illustrates why the ending result alone can mislead: the index finished up 9.49% but reached 13.93% below its starting level. The highs and lows show the range investors faced, without revealing their order or measuring a peak-to-trough drawdown.[3]
What happened inside each seasonal window

View exact TradeWave observations and download
| Window starting year | Ending price change | Highest from entry | Lowest from entry |
|---|---|---|---|
| 1966 | +14.39% | +16.24% | -3.72% |
| 1970 | +16.56% | +24.19% | -3.29% |
| 1974 | +21.69% | +28.52% | -14.66% |
| 1978 | +9.08% | +12.93% | -1.46% |
| 1982 | +19.15% | +21.06% | -6.25% |
| 1986 | +24.85% | +27.32% | -4.68% |
| 1990 | +19.84% | +22.47% | -3.17% |
| 1994 | +20.39% | +21.76% | -4.21% |
| 1998 | +21.41% | +26.71% | -0.48% |
| 2002 | +12.77% | +15.89% | -9.96% |
| 2006 | +11.35% | +12.39% | -1.48% |
| 2010 | +10.83% | +12.94% | -3.34% |
| 2014 | +3.65% | +4.66% | -3.29% |
| 2018 | +9.49% | +10.70% | -13.93% |
| 2022 | +14.07% | +14.66% | -5.72% |
Looking across all years
The 2016–2025 and 2006–2025 comparisons test whether the favorable reading extends across all years; both include losses, and the longer history’s 9.04% median is below the selected midterms’ 14.39%. Fifteen midterms provide limited reassurance. The shorter comparison reuses 2018 and 2022; the longer also reuses 2006, 2010 and 2014, limiting independent confirmation. These comparisons do not establish an election effect.[3]
See the history behind this comparison
TradeWave checks the same seasonal dates across different sets of years. This helps show whether the pattern holds up when you look at another stretch of history.
| History | Observed start years | Direction | Success rate | Median result |
|---|---|---|---|---|
| Article study: 15 selected midterm-election years (1966–2022) | 1966, 1970, 1974, 1978, 1982, 1986, 1990, 1994, 1998, 2002, 2006, 2010, 2014, 2018, 2022 | long | 100.0% | 14.39% |
| 10 consecutive historical windows (2016–2025) | 2016, 2017, 2018, 2019, 2020, 2021, 2022, 2023, 2024, 2025 | long | 90.0% | 9.51% |
| 20 consecutive historical windows (2006–2025) | 2006, 2007, 2008, 2009, 2010, 2011, 2012, 2013, 2014, 2015, 2016, 2017, 2018, 2019, 2020, 2021, 2022, 2023, 2024, 2025 | long | 85.0% | 9.04% |
Some years appear in more than one group, so agreement is not an independent test. A requested lookback can extend beyond available history; the observed years are listed above. Election-cycle groups use matching phases, not consecutive years. Results follow the direction shown: a positive short result means prices fell. Small samples and different market periods make the comparison less conclusive.
Before November 11
The next seasonal question is the index’s condition when the November 11 window begins. Recorded prices end November 2, 2026. The illustration below places TradeWave’s normalized seasonal overlay from this article’s selected years alongside the recorded index history. It covers the next 60 weekdays, November 3, 2026–January 25, 2027, a shorter horizon than the full seasonal window. Those future dates belong only to the historical illustration, not recorded prices or a forecast. Compare this same window across the supplied histories and inspect its range of outcomes in TradeWave.[3]
Price history and the seasonal outlook

Explore this exact seasonal window in TradeWave. Compare its win rate and average result across different histories, and inspect how far prices moved above or below their starting point. Account access applies in TradeWave.
About this seasonal analysis
15 selected midterm-election years (1966–2022). The selected dates, years, direction, returns and ranges come from TradeWave. When a window boundary is a weekend or market holiday, TradeWave uses the next available trading session. SMN displays the returned results without recalculating them. A year label identifies the start of the historical window; a window can end in the following calendar year.
Green and red bars show the underlying adjusted-price movement. The range endpoints measure changes from the entry price, not a peak-to-trough loss. Historical results are before trading costs and do not guarantee future performance.
Sources & methodology
- 2026 Q3 Earnings Call · 2026-10-28
- Okta Set to Join S&P 500; Others to Join S&P MidCap 400 and S&P SmallCap 600 · 2026-10-30
- TradeWave SPX seasonal evidence · 2026-11-03