
Can McDonald’s turn its push for better U.S. restaurant execution into stronger growth? Skye Anderson’s appointment as U.S. president, effective August 4, put that task under new leadership.[4]
The November 2, 2026–July 10, 2027 seasonal window is underway. All ten selected historical midterm windows finished higher, although broader histories were less consistent. That offers timing context for investors assessing the business, not evidence that improvement will follow.[5]
Sales before NEXT
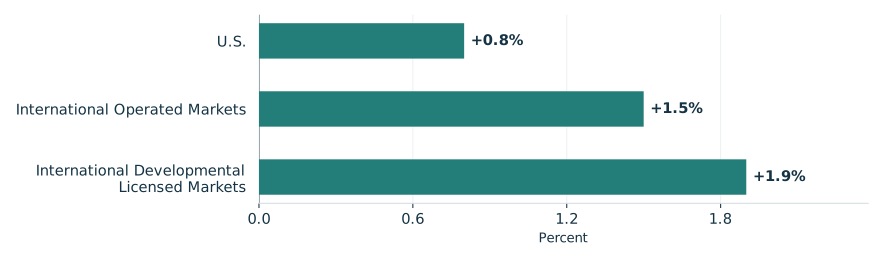
The August 4 release reported June-quarter global comparable sales growth of 1.3%. U.S. growth was 0.8%, versus 2.5% a year earlier: higher checks, including favorable product mix, offset falling guest counts. Management emphasized stronger U.S. execution. Germany, Australia and the U.K. led operated markets, partly offset by France; Japan led licensed markets, with China a drag.[2]
September 23’s NEXT targets envisage unit expansion contributing nearly 2.5% to Systemwide sales growth in 2027, easing to about 2% by 2030; operating margin reaching the low to mid 50% range by 2030; and about 250 basis points of gross restaurant efficiency gains as deployment proceeds. Franchisee support was planned through 2036. These are ambitions, not November results.[3]
Second quarter comparable sales grew across McDonald's segments
Reported year over year comparable sales growth, quarter ended June 30, 2026

View chart data & download
| Measure | Value | Period | Status |
|---|---|---|---|
| U.S. | +0.8% | Q2 2026 | reported |
| International Operated Markets | +1.5% | Q2 2026 | reported |
| International Developmental Licensed Markets | +1.9% | Q2 2026 | reported |
A favorable selected record
TradeWave’s ten selected midterm-election years span 1986–2022, with a median full-window long result of 22.68%. These are separated election-phase observations, not consecutive years. The full-window result is not the return remaining after November 4.[5]
The year-by-year seasonal record

View exact TradeWave observations and download
| Window starting year | Ending price change | Highest from entry | Lowest from entry |
|---|---|---|---|
| 1986 | +35.62% | +46.81% | -5.35% |
| 1990 | +29.85% | +41.27% | +0.00% |
| 1994 | +30.66% | +35.82% | -4.93% |
| 1998 | +30.42% | +40.29% | -3.14% |
| 2002 | +22.46% | +27.86% | -33.32% |
| 2006 | +22.63% | +28.82% | -2.00% |
| 2010 | +11.44% | +12.67% | -7.26% |
| 2014 | +7.07% | +9.89% | -5.57% |
| 2018 | +22.74% | +23.00% | -3.77% |
| 2022 | +10.75% | +12.49% | -3.48% |
Explore this exact seasonal window in TradeWave. Compare its win rate and average result across different histories, and inspect how far prices moved above or below their starting point. Account access applies in TradeWave.
Winning could still be painful
The yearly range chart shows each year’s same seasonal period, not its whole calendar year. November 2, 2002–July 10, 2003 is useful because its 22.46% ending gain accompanied a move 33.32% below the starting price. Highs and lows reveal discomfort hidden by the ending result, without establishing their order or peak-to-trough loss.[5]
What happened inside each seasonal window

View exact TradeWave observations and download
| Window starting year | Ending price change | Highest from entry | Lowest from entry |
|---|---|---|---|
| 1986 | +35.62% | +46.81% | -5.35% |
| 1990 | +29.85% | +41.27% | +0.00% |
| 1994 | +30.66% | +35.82% | -4.93% |
| 1998 | +30.42% | +40.29% | -3.14% |
| 2002 | +22.46% | +27.86% | -33.32% |
| 2006 | +22.63% | +28.82% | -2.00% |
| 2010 | +11.44% | +12.67% | -7.26% |
| 2014 | +7.07% | +9.89% | -5.57% |
| 2018 | +22.74% | +23.00% | -3.77% |
| 2022 | +10.75% | +12.49% | -3.48% |
Broader histories temper confidence
Checking the same window across all years tests how widely the encouragement applies: 2016–2025 had 60.0% profitable windows, versus 75.0% for 2006–2025. These histories share two and five observations, respectively, with the small midterm sample, limiting independent confirmation. Within that sample, 1986 gained 35.62% versus 2022’s 10.75%, illustrating differing outcomes across eras, not election causation.[5]
See the history behind this comparison
TradeWave checks the same seasonal dates across different sets of years. This helps show whether the pattern holds up when you look at another stretch of history.
| History | Observed start years | Direction | Success rate | Median result |
|---|---|---|---|---|
| Article study: 10 selected midterm-election years (1986–2022) | 1986, 1990, 1994, 1998, 2002, 2006, 2010, 2014, 2018, 2022 | long | 100.0% | 22.68% |
| 10 consecutive historical windows (2016–2025) | 2016, 2017, 2018, 2019, 2020, 2021, 2022, 2023, 2024, 2025 | long | 60.0% | 3.5% |
| 20 consecutive historical windows (2006–2025) | 2006, 2007, 2008, 2009, 2010, 2011, 2012, 2013, 2014, 2015, 2016, 2017, 2018, 2019, 2020, 2021, 2022, 2023, 2024, 2025 | long | 75.0% | 6.52% |
Some years appear in more than one group, so agreement is not an independent test. A requested lookback can extend beyond available history; the observed years are listed above. Election-cycle groups use matching phases, not consecutive years. Results follow the direction shown: a positive short result means prices fell. Small samples and different market periods make the comparison less conclusive.
What to inspect next
The price chart below uses this article’s selected years for TradeWave’s seasonal overlay. Recorded prices end November 3, 2026. November 4–January 26, 2027 covers the next 60 weekdays of historical illustration, shorter than the full window, not future recorded prices or a forecast.[5]
Can execution deliver NEXT’s intended guest-count growth? While awaiting evidence, inspect this same window’s ending results and ranges across histories in TradeWave.[3][5]
Price history and the seasonal outlook

Explore this exact seasonal window in TradeWave. Compare its win rate and average result across different histories, and inspect how far prices moved above or below their starting point. Account access applies in TradeWave.
About this seasonal analysis
10 selected midterm-election years (1986–2022). The selected dates, years, direction, returns and ranges come from TradeWave. When a window boundary is a weekend or market holiday, TradeWave uses the next available trading session. SMN displays the returned results without recalculating them. A year label identifies the start of the historical window; a window can end in the following calendar year.
Green and red bars show the underlying adjusted-price movement. The range endpoints measure changes from the entry price, not a peak-to-trough loss. Historical results are before trading costs and do not guarantee future performance.
Sources & methodology
- FORM 10-Q · 2026-08-07
- McDONALD'S REPORTS SECOND QUARTER 2026 RESULTS · 2026-08-04
- McDONALD'S ADVANCES NEXT STRATEGY TO BECOME FIRST CHOICE FOR MORE CUSTOMERS, MORE OFTEN · 2026-09-23
- McDonald's Appoints Skye Anderson as President of McDonald's USA · 2026-08-04
- TradeWave MCD seasonal evidence · 2026-11-04