
Marvell shareholders have a proposed Lumentum acquisition to weigh as December approaches. How much weight should they give the stock’s seasonal tendency to fall while the deal’s benefits remain prospective?[1][4]
TradeWave’s December 6–20, 2026 window spans 15 calendar days. Shares fell in all six selected historical midterm years, favoring the short direction. Yet the same dates across 2016–2025 split evenly between gains and losses.[4]
Deal forecasts and reported revenue
Marvell signed the merger agreement November 1, 2026.[2]
Announced November 2, the uncompleted deal offers 4.500 Marvell shares per Lumentum share. Closing is forecast for first-half 2028, subject to shareholder and regulatory approvals and other conditions. Management projects stronger long-term growth and non-GAAP margins, more than $1 billion in annual run-rate cost synergies and first-year post-close non-GAAP EPS accretion.[1]
Marvell’s November 2 preliminary fiscal Q3 2027 revenue estimate retained its guidance midpoint, narrowing the range from ±5% to ±2%. It remains unaudited and subject to change.[1]
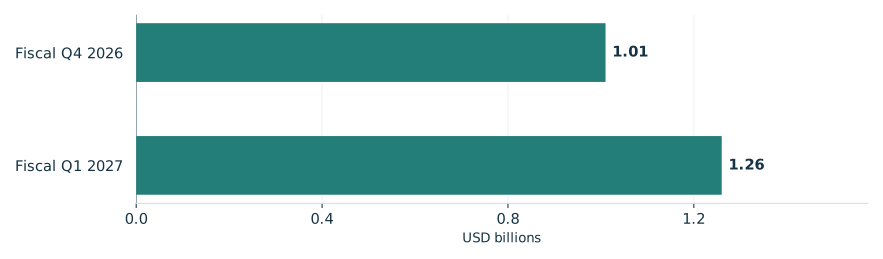
Lumentum revenue rose before the proposed combination
Reported quarterly net revenue

View chart data & download
| Measure | Value | Period | Status |
|---|---|---|---|
| Fiscal Q4 2026 | 1.01 | Fiscal Q4 2026 | reported |
| Fiscal Q1 2027 | 1.26 | Fiscal Q1 2027 | reported |
What the selected midterms show
TradeWave’s seasonal record isolates six midterm years spanning 2002–2022. Its rounded average full-window short result was 7.26%, before trading costs. Positive short results mean falling prices favored that direction; the bars retain actual price changes. Six observations offer limited confidence about another occurrence.[4]
The year-by-year seasonal record

View exact TradeWave observations and download
| Window starting year | Ending price change | Highest from entry | Lowest from entry |
|---|---|---|---|
| 2002 | -10.22% | +5.99% | -14.21% |
| 2006 | -6.83% | +2.87% | -8.90% |
| 2010 | -5.88% | +2.03% | -8.75% |
| 2014 | -4.94% | +0.00% | -9.36% |
| 2018 | -7.71% | +0.00% | -9.07% |
| 2022 | -7.98% | +11.92% | -10.20% |
Explore this exact seasonal window in TradeWave. Compare its win rate and average result across different histories, and inspect how far prices moved above or below their starting point. Account access applies in TradeWave.
A favorable finish could involve pain
The yearly range chart covers the same seasonal period each year, not whole calendar years. December 6–20, 2022 illustrates why the finish alone is insufficient: shares ended down 7.98% but also reached 11.92% above the starting price, adverse for a short position. The highs and lows reveal neither their order nor peak-to-trough drawdown.[4]
What happened inside each seasonal window

View exact TradeWave observations and download
| Window starting year | Ending price change | Highest from entry | Lowest from entry |
|---|---|---|---|
| 2002 | -10.22% | +5.99% | -14.21% |
| 2006 | -6.83% | +2.87% | -8.90% |
| 2010 | -5.88% | +2.03% | -8.75% |
| 2014 | -4.94% | +0.00% | -9.36% |
| 2018 | -7.71% | +0.00% | -9.07% |
| 2022 | -7.98% | +11.92% | -10.20% |
Broader histories weaken the inference
Checking across all years tests how far the midterm finding travels. Alongside the evenly split 2016–2025 record, the 2006–2025 study had a rounded all-window short average of -0.1%. Neither independently confirms the selected result: the shorter history reuses 2018 and 2022; the longer reuses every selected year except 2002. The pattern depends on the years examined, without establishing an election effect.[4]
See the history behind this comparison
TradeWave checks the same seasonal dates across different sets of years. This helps show whether the pattern holds up when you look at another stretch of history.
| History | Observed start years | Direction | Success rate | Median result |
|---|---|---|---|---|
| Article study: 6 selected midterm-election years (2002–2022) | 2002, 2006, 2010, 2014, 2018, 2022 | short | 100.0% | 7.27% |
| 10 consecutive historical windows (2016–2025) | 2016, 2017, 2018, 2019, 2020, 2021, 2022, 2023, 2024, 2025 | long | 50.0% | 0.29% |
| 20 consecutive historical windows (2006–2025) | 2006, 2007, 2008, 2009, 2010, 2011, 2012, 2013, 2014, 2015, 2016, 2017, 2018, 2019, 2020, 2021, 2022, 2023, 2024, 2025 | short | 65.0% | 1.47% |
Some years appear in more than one group, so agreement is not an independent test. A requested lookback can extend beyond available history; the observed years are listed above. Election-cycle groups use matching phases, not consecutive years. Results follow the direction shown: a positive short result means prices fell. Small samples and different market periods make the comparison less conclusive.
Before December begins
Revisit conditions at December 6 and compare these histories in TradeWave; November 5 observations cannot establish the future starting condition. Its November 26 earnings estimate is unconfirmed. Below, recorded prices end November 5, 2026. The engine’s seasonal overlay uses the same six selected midterm years to illustrate historical shape over the next 60 weekdays, November 6–January 28, 2027, separately from the full study window. It is no price target or earnings prediction.[4]
Price history and the seasonal outlook

Explore this exact seasonal window in TradeWave. Compare its win rate and average result across different histories, and inspect how far prices moved above or below their starting point. Account access applies in TradeWave.
About this seasonal analysis
6 selected midterm-election years (2002–2022). The selected dates, years, direction, returns and ranges come from TradeWave. When a window boundary is a weekend or market holiday, TradeWave uses the next available trading session. SMN displays the returned results without recalculating them. A year label identifies the start of the historical window; a window can end in the following calendar year.
Green and red bars show the underlying adjusted-price movement. The range endpoints measure changes from the entry price, not a peak-to-trough loss. Historical results are before trading costs and do not guarantee future performance.
Sources & methodology
- Marvell and Lumentum to Combine, Creating a Category Leader in AI Connectivity · 2026-11-02
- November 2, 2026 - 425: Prospectuses and communications, business combinations · 2026-11-02
- Lumentum Announces First Quarter of Fiscal Year 2027 Financial Results · 2026-11-02
- TradeWave MRVL seasonal evidence · 2026-11-06