
Disney shareholders are waiting to see whether earnings growth can hold up as strength in parks and cruises meets pressure elsewhere. Fiscal 2026 full-year and fourth-quarter results arrive November 17, before regular trading.[1][2]
That release falls inside the November 10, 2026–April 23, 2027 seasonal window. All 10 selected midterm-year windows finished higher, yet only half the windows starting in 2016–2025 gained, raising the question of how much reassurance that selected history offers now.[3][2]
Earnings and the extra week
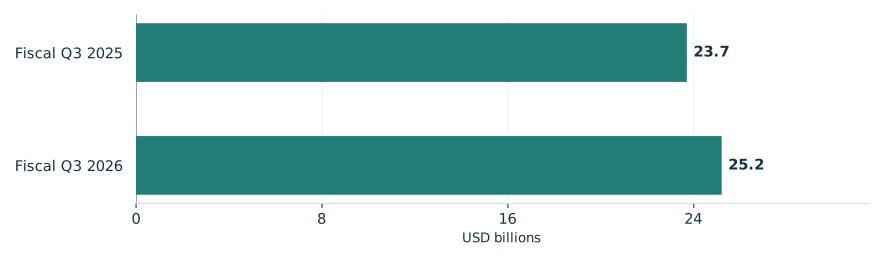
Disney’s August 5 report covered the quarter ended June 27, 2026. Revenue rose to $25.2 billion from $23.7 billion a year earlier. GAAP diluted EPS fell to $1.51 from $2.92, while adjusted EPS, excluding certain items, rose to $2.06 from $1.61.[1]
Management forecast fiscal 2026 adjusted EPS growth of about 12% excluding the 53rd week, or 16% including it. Its roughly $4.9 billion fourth-quarter total segment operating-income forecast includes about $600 million from that week. Fiscal 2027 adjusted EPS growth was forecast at double digits excluding the extra-week effect.[1]
Domestic parks, cruises, Consumer Products and Disneyland Paris helped offset Asia parks softness, which management expected to persist in Q4. A tariff refund added roughly four percentage points to Q3 Experiences operating-income growth; management expected any further refunds to be insignificant.[1]
Disney’s reported third-quarter revenue rose
Fiscal third-quarter revenue, company reported

View chart data & download
| Measure | Value | Period | Status |
|---|---|---|---|
| Fiscal Q3 2025 | 23.7 | Q3 FY2025 | reported |
| Fiscal Q3 2026 | 25.2 | Q3 FY2026 | reported |
Strength in selected midterm years
TradeWave’s selected seasonal record covers 10 midterm-election start years spanning 1986–2022, with a median full-window long result of 17.32%. That favorable finish describes a small historical sample, not an expected return or evidence about earnings.[3]
The year-by-year seasonal record

View exact TradeWave observations and download
| Window starting year | Ending price change | Highest from entry | Lowest from entry |
|---|---|---|---|
| 1986 | +43.19% | +53.00% | -11.45% |
| 1990 | +26.97% | +38.24% | -0.25% |
| 1994 | +30.46% | +31.41% | -2.33% |
| 1998 | +19.48% | +33.98% | -2.60% |
| 2002 | +12.15% | +16.52% | -13.50% |
| 2006 | +9.25% | +12.40% | -2.16% |
| 2010 | +14.60% | +21.18% | -4.97% |
| 2014 | +22.95% | +23.97% | -1.15% |
| 2018 | +15.16% | +15.92% | -13.34% |
| 2022 | +10.19% | +30.64% | -7.06% |
Explore this exact seasonal window in TradeWave. Compare its win rate and average result across different histories, and inspect how far prices moved above or below their starting point. Account access applies in TradeWave.
A winning finish can conceal losses
The yearly range chart shows highs and lows during the same seasonal period, not whole calendar years. November 10, 2018–April 23, 2019 illustrates why the ending return is only part of the experience: it finished up 15.16% but reached 13.34% below the starting price. The chart does not establish the order of those moves or measure a peak-to-trough loss.[3]
What happened inside each seasonal window

View exact TradeWave observations and download
| Window starting year | Ending price change | Highest from entry | Lowest from entry |
|---|---|---|---|
| 1986 | +43.19% | +53.00% | -11.45% |
| 1990 | +26.97% | +38.24% | -0.25% |
| 1994 | +30.46% | +31.41% | -2.33% |
| 1998 | +19.48% | +33.98% | -2.60% |
| 2002 | +12.15% | +16.52% | -13.50% |
| 2006 | +9.25% | +12.40% | -2.16% |
| 2010 | +14.60% | +21.18% | -4.97% |
| 2014 | +22.95% | +23.97% | -1.15% |
| 2018 | +15.16% | +15.92% | -13.34% |
| 2022 | +10.19% | +30.64% | -7.06% |
Broader histories temper confidence
Broader histories check whether strength extends across all years: success was 50.0% for 2016–2025 versus 60.0% for 2006–2025, leaving the recent record less reassuring. The former reuses selected midterms 2018 and 2022; the latter also reuses 2006, 2010 and 2014, while both share 2016–2025. These overlaps limit independent confirmation, and the small selected sample cannot establish an election effect.[3]
See the history behind this comparison
TradeWave checks the same seasonal dates across different sets of years. This helps show whether the pattern holds up when you look at another stretch of history.
| History | Observed start years | Direction | Success rate | Median result |
|---|---|---|---|---|
| Article study: 10 selected midterm-election years (1986–2022) | 1986, 1990, 1994, 1998, 2002, 2006, 2010, 2014, 2018, 2022 | long | 100.0% | 17.32% |
| 10 consecutive historical windows (2016–2025) | 2016, 2017, 2018, 2019, 2020, 2021, 2022, 2023, 2024, 2025 | long | 50.0% | 3.27% |
| 20 consecutive historical windows (2006–2025) | 2006, 2007, 2008, 2009, 2010, 2011, 2012, 2013, 2014, 2015, 2016, 2017, 2018, 2019, 2020, 2021, 2022, 2023, 2024, 2025 | long | 60.0% | 12.4% |
Some years appear in more than one group, so agreement is not an independent test. A requested lookback can extend beyond available history; the observed years are listed above. Election-cycle groups use matching phases, not consecutive years. Results follow the direction shown: a positive short result means prices fell. Small samples and different market periods make the comparison less conclusive.
Inspect the path and the results
Management attributed Sports’ lower-than-expected Q3 operating income partly to four-game sweeps in early NBA playoff rounds and a network carriage dispute. For Q4 Entertainment, it flagged Moana’s below-expectation box office and softer-than-expected advertising, particularly in domestic subscription streaming.[1]
The price chart below has recorded prices through November 6, 2026, before the window opens. Its engine-supplied seasonal overlay uses this article’s selected midterm years over the next 60 weekdays, November 9, 2026–January 29, 2027, a separate, shorter horizon than the full seasonal window. It illustrates historical shape, not future recorded prices, an earnings prediction or a price target.[3]
November 17 results and the 8:30 a.m. ET webcast are the next opportunity to assess how earnings developed. In TradeWave, compare this same window across histories and inspect the range of outcomes behind its favorable selected record.[2][3]
Price history and the seasonal outlook

Explore this exact seasonal window in TradeWave. Compare its win rate and average result across different histories, and inspect how far prices moved above or below their starting point. Account access applies in TradeWave.
About this seasonal analysis
10 selected midterm-election years (1986–2022). The selected dates, years, direction, returns and ranges come from TradeWave. When a window boundary is a weekend or market holiday, TradeWave uses the next available trading session. SMN displays the returned results without recalculating them. A year label identifies the start of the historical window; a window can end in the following calendar year.
Green and red bars show the underlying adjusted-price movement. The range endpoints measure changes from the entry price, not a peak-to-trough loss. Historical results are before trading costs and do not guarantee future performance.
Sources & methodology
- EARNINGS RELEASE · 2026-08-05
- The Walt Disney Company Executives to Discuss Fiscal Full Year and Fourth Quarter 2026 Financial Results via Webcast · 2026-10-12
- TradeWave DIS seasonal evidence · 2026-11-09