
NVIDIA shareholders face unanswered questions about leadership and security after the board’s November 8 investigation announcement. How much reassurance can past share performance offer while the inquiry’s findings remain unknown?[1]
The November 17–December 2, 2026 seasonal window is still ahead. The same calendar period gained in all six selected historical midterm years from 2002 through 2022, but broader histories differ in direction. That makes the favorable record a limited guide as the inquiry unfolds.[4][1]
An inquiry before results
The board initiated an independent inquiry following reports that Jensen Huang was targeted by a foreign intelligence effort. Independent directors and outside counsel will oversee it. The board said it had no reason to believe national security or NVIDIA secrets were compromised and expressed confidence in current leadership. It announced no findings or date for an update.[1]
In his November 8 message, Huang acknowledged infidelity and pledged full cooperation with the investigation.[2]
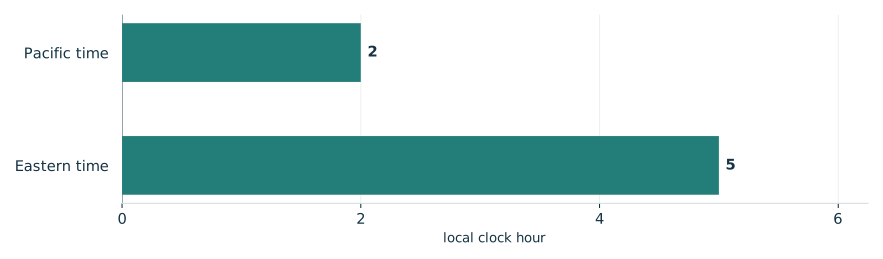
NVIDIA’s October 28 notice schedules fiscal 2027 third-quarter results for November 17, the seasonal entry date, at approximately 1:20 p.m. Pacific, followed by a 2 p.m. call. The quarter ended October 25, 2026. These results remain upcoming on November 9; the company’s date supersedes TradeWave’s November 25 estimate.[3][4]
Scheduled earnings call times
November 17, 2026; local clock hours in two time zones

View chart data & download
| Measure | Value | Period | Status |
|---|---|---|---|
| Pacific time | 2 | 2026-11-17 | reported |
| Eastern time | 5 | 2026-11-17 | reported |
Six favorable midterm windows
TradeWave’s selected seasonal record shows a 9.5% median full-window long result. It describes six completed midterm-election windows, not six consecutive years. That offers historical context for the shares’ timing, but cannot answer the questions raised by today’s investigation.[4][1]
The year-by-year seasonal record

View exact TradeWave observations and download
| Window starting year | Ending price change | Highest from entry | Lowest from entry |
|---|---|---|---|
| 2002 | +21.67% | +30.77% | -1.63% |
| 2006 | +1.82% | +3.09% | -4.62% |
| 2010 | +11.33% | +12.03% | +0.00% |
| 2014 | +5.09% | +7.53% | -0.19% |
| 2018 | +17.63% | +20.84% | -7.87% |
| 2022 | +7.68% | +10.16% | -3.81% |
Explore this exact seasonal window in TradeWave. Compare its win rate and average result across different histories, and inspect how far prices moved above or below their starting point. Account access applies in TradeWave.
Gains could include substantial declines
The yearly range chart covers the same seasonal period each year, not whole calendar years. November 17–December 2, 2018 is useful because its 17.63% ending gain accompanied a move 7.87% below the starting price. A favorable ending therefore did not mean an easy holding period. The highs and lows do not reveal their sequence or measure a peak-to-trough loss.[4]
What happened inside each seasonal window

View exact TradeWave observations and download
| Window starting year | Ending price change | Highest from entry | Lowest from entry |
|---|---|---|---|
| 2002 | +21.67% | +30.77% | -1.63% |
| 2006 | +1.82% | +3.09% | -4.62% |
| 2010 | +11.33% | +12.03% | +0.00% |
| 2014 | +5.09% | +7.53% | -0.19% |
| 2018 | +17.63% | +20.84% | -7.87% |
| 2022 | +7.68% | +10.16% | -3.81% |
Broader histories change the reading
TradeWave checks all years to see whether the selected finding extends further: the 2016–2025 median favors shorts, while 2006–2025 favors longs. Positive short results mean falling prices, though the shorter study’s all-window average is negative; the chart preserves actual price moves. These histories reuse two and five selected midterm observations, respectively, and overlap each other, offering limited independent reassurance from six observations.[4]
See the history behind this comparison
TradeWave checks the same seasonal dates across different sets of years. This helps show whether the pattern holds up when you look at another stretch of history.
| History | Observed start years | Direction | Success rate | Median result |
|---|---|---|---|---|
| Article study: 6 selected midterm-election years (2002–2022) | 2002, 2006, 2010, 2014, 2018, 2022 | long | 100.0% | 9.5% |
| 10 consecutive historical windows (2016–2025) | 2016, 2017, 2018, 2019, 2020, 2021, 2022, 2023, 2024, 2025 | short | 60.0% | 1.22% |
| 20 consecutive historical windows (2006–2025) | 2006, 2007, 2008, 2009, 2010, 2011, 2012, 2013, 2014, 2015, 2016, 2017, 2018, 2019, 2020, 2021, 2022, 2023, 2024, 2025 | long | 65.0% | 1.45% |
Some years appear in more than one group, so agreement is not an independent test. A requested lookback can extend beyond available history; the observed years are listed above. Election-cycle groups use matching phases, not consecutive years. Results follow the direction shown: a positive short result means prices fell. Small samples and different market periods make the comparison less conclusive.
What to inspect next
November 17 results are the next confirmed checkpoint; the inquiry’s timing remains open. In TradeWave, compare this same window across histories and inspect how far shares moved below their starting prices.[3][1][4]
The following price chart uses this article’s six selected midterm years for the engine’s seasonal overlay. Recorded prices end November 6, 2026, before the statements and window entry. Only the historical illustration extends over the next 60 weekdays, November 9, 2026–January 29, 2027, a separate horizon from the full seasonal window. It illustrates historical shape, not future recorded prices, an earnings prediction or a price target.[4]
Price history and the seasonal outlook

Explore this exact seasonal window in TradeWave. Compare its win rate and average result across different histories, and inspect how far prices moved above or below their starting point. Account access applies in TradeWave.
About this seasonal analysis
6 selected midterm-election years (2002–2022). The selected dates, years, direction, returns and ranges come from TradeWave. When a window boundary is a weekend or market holiday, TradeWave uses the next available trading session. SMN displays the returned results without recalculating them. A year label identifies the start of the historical window; a window can end in the following calendar year.
Green and red bars show the underlying adjusted-price movement. The range endpoints measure changes from the entry price, not a peak-to-trough loss. Historical results are before trading costs and do not guarantee future performance.
Sources & methodology
- Statement From NVIDIA Board of Directors · 2026-11-08
- A Message to Our Company · 2026-11-08
- NVIDIA Sets Conference Call for Third-Quarter Financial Results · 2026-10-28
- TradeWave NVDA seasonal evidence · 2026-11-09