
Can AMD's Data Center demand carry it toward approximately $17 billion in fourth-quarter sales? Investors enter this seasonal window with substantial growth already embedded in management's expectations.[1]
The November 10, 2026–November 6, 2027 window begins today. Nine of ten corresponding windows starting in 2016–2025 gained, but older and midterm-election histories are less reassuring. How much weight should investors give that favorable recent record while watching AMD deliver on its outlook?[4][1]
What Q4 requires
AMD's November 3 report covered the quarter ended September 26, 2026. Revenue rose 45% to $13.4 billion from $9.246 billion a year earlier. GAAP gross margin and diluted EPS were 54% and $1.46; non-GAAP figures were 56% and $2.09.[1]
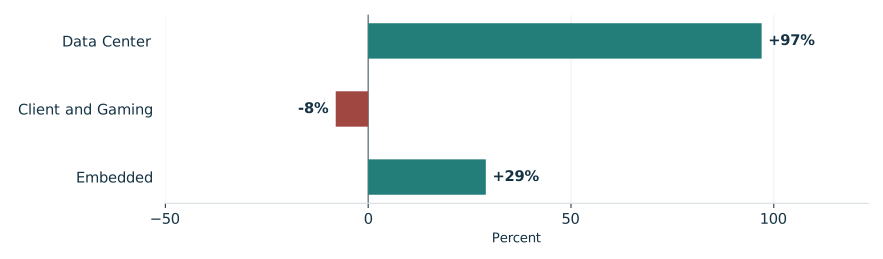
EPYC demand and the MI450 launch drove Data Center revenue to $8.5 billion, up 97% year over year. Client grew 7%, supported by Ryzen mobile sales, partly offsetting Gaming's 40% decline from lower semi-custom and graphics revenue. Combined Client and Gaming revenue fell 8%. Embedded grew 29%, led by aerospace and defense, automotive, communications and industrial markets.[1]
Management attributes its Q4 outlook to Data Center demand; CEO Lisa Su expected growth to accelerate as AMD scaled Helios and Venice production. Revenue guidance is approximately $17 billion, plus or minus 3%, with midpoint growth of approximately 66% year over year and 27% sequentially.[1]
AMD's third-quarter segment growth was uneven
Reported year-over-year revenue change, third quarter 2026

View chart data & download
| Measure | Value | Period | Status |
|---|---|---|---|
| Data Center | +97% | Q3 2026 year over year | reported |
| Client and Gaming | -8% | Q3 2026 year over year | reported |
| Embedded | +29% | Q3 2026 year over year | reported |
Almost a year of exposure
TradeWave's selected seasonal record puts the median full-window long result at 83.85%. That describes almost a year of exposure, not a brief year-end rally or an expected return. Its strength is less convincing when you look further back.[4]
The year-by-year seasonal record

View exact TradeWave observations and download
| Window starting year | Ending price change | Highest from entry | Lowest from entry |
|---|---|---|---|
| 2016 | +89.37% | +148.41% | +0.00% |
| 2017 | +83.66% | +203.20% | -19.72% |
| 2018 | +88.81% | +95.38% | -15.76% |
| 2019 | +136.52% | +159.65% | +0.00% |
| 2020 | +92.54% | +96.95% | -7.04% |
| 2021 | -54.90% | +17.58% | -60.99% |
| 2022 | +63.21% | +94.00% | -12.30% |
| 2023 | +22.35% | +91.67% | -2.18% |
| 2024 | +61.32% | +81.26% | -48.10% |
| 2025 | +84.05% | +169.91% | -22.85% |
Explore this exact seasonal window in TradeWave. Compare its win rate and average result across different histories, and inspect how far prices moved above or below their starting point. Account access applies in TradeWave.
A gain can conceal substantial pain
The yearly range chart shows each year's same seasonal period, not the whole calendar year. November 10, 2024–November 6, 2025 is useful because it ended up 61.32% despite reaching 48.1% below the starting price. Highs and lows reveal what ending returns conceal, without establishing their order or a peak-to-trough drawdown. Those ranges are historical observations, not stops or forecasts.[4]
What happened inside each seasonal window

View exact TradeWave observations and download
| Window starting year | Ending price change | Highest from entry | Lowest from entry |
|---|---|---|---|
| 2016 | +89.37% | +148.41% | +0.00% |
| 2017 | +83.66% | +203.20% | -19.72% |
| 2018 | +88.81% | +95.38% | -15.76% |
| 2019 | +136.52% | +159.65% | +0.00% |
| 2020 | +92.54% | +96.95% | -7.04% |
| 2021 | -54.90% | +17.58% | -60.99% |
| 2022 | +63.21% | +94.00% | -12.30% |
| 2023 | +22.35% | +91.67% | -2.18% |
| 2024 | +61.32% | +81.26% | -48.10% |
| 2025 | +84.05% | +169.91% | -22.85% |
Further back, less consistent
Checking whether recent strength holds across longer history lowers success from 90.0% in 2016–2025 to 65.0% in 2006–2025, reusing all ten primary observations. In ten selected midterm-election years spanning 1986–2022, six windows fell, favoring shorts, yet the average short result across all windows was -36.28%. This mixed comparison weakens confidence in repetition without establishing an election effect: results differ across eras, and the small midterm sample reuses two primary observations, limiting independent confirmation.[4]
See the history behind this comparison
TradeWave checks the same seasonal dates across different sets of years. This helps show whether the pattern holds up when you look at another stretch of history.
| History | Observed start years | Direction | Success rate | Median result |
|---|---|---|---|---|
| Article study: 10 consecutive historical windows (2016–2025) | 2016, 2017, 2018, 2019, 2020, 2021, 2022, 2023, 2024, 2025 | long | 90.0% | 83.85% |
| 20 consecutive historical windows (2006–2025) | 2006, 2007, 2008, 2009, 2010, 2011, 2012, 2013, 2014, 2015, 2016, 2017, 2018, 2019, 2020, 2021, 2022, 2023, 2024, 2025 | long | 65.0% | 62.26% |
| 10 selected midterm-election years (1986–2022) | 1986, 1990, 1994, 1998, 2002, 2006, 2010, 2014, 2018, 2022 | short | 60.0% | 14.08% |
Some years appear in more than one group, so agreement is not an independent test. A requested lookback can extend beyond available history; the observed years are listed above. Election-cycle groups use matching phases, not consecutive years. Results follow the direction shown: a positive short result means prices fell. Small samples and different market periods make the comparison less conclusive.
Follow delivery and inspect the ranges
The next business question is whether production scales enough to deliver Q4 guidance. AMD forecasts approximately 55% non-GAAP gross margin, versus Q3's 56%. It supplies no corresponding GAAP forecast because the necessary adjustments depend on uncertain future events.[1]
In TradeWave, compare this same window across histories and inspect its range of outcomes. The price illustration below uses the selected 2016–2025 years and the engine's seasonal overlay for the next 60 weekdays, November 10, 2026–February 1, 2027, separate from the full window. Recorded prices end November 9, 2026, establishing no November 10 entry price. The future span belongs only to the seasonal illustration, which shows historical shape, not future earnings or a price target.[4]
Price history and the seasonal outlook

Explore this exact seasonal window in TradeWave. Compare its win rate and average result across different histories, and inspect how far prices moved above or below their starting point. Account access applies in TradeWave.
About this seasonal analysis
10 consecutive historical windows (2016–2025). The selected dates, years, direction, returns and ranges come from TradeWave. When a window boundary is a weekend or market holiday, TradeWave uses the next available trading session. SMN displays the returned results without recalculating them. A year label identifies the start of the historical window; a window can end in the following calendar year.
Green and red bars show the underlying adjusted-price movement. The range endpoints measure changes from the entry price, not a peak-to-trough loss. Historical results are before trading costs and do not guarantee future performance.