QQQ investors are waiting to hear whether NVIDIA can maintain continuity after its CEO’s departure. Today’s scheduled earnings arrive just as the ETF’s TradeWave seasonal window gets underway.[3][4]
The current window runs from November 15, 2026 to May 15, 2027. QQQ finished higher over the corresponding period in all six selected midterm years from 2002–2022, although broader histories include losses. How much confidence should investors place in that favorable seasonal record now?[4]
NVIDIA’s transition, QQQ’s mixed backdrop
NVIDIA announced Jensen Huang’s immediate resignation on November 12 and appointed Colette Kress interim CEO while she retains her finance role. Its board expects operations, customer commitments and the product roadmap to continue uninterrupted. Fiscal 2027 third-quarter results are scheduled for November 17, 2026 at approximately 1:20 p.m. Pacific, followed by a 2 p.m. call. The captured release contains no results.[3]
QQQ tracks the Nasdaq-100. Invesco’s October 28 report put its third-quarter NAV return through September 30 at 0.53%, versus 2.30% for the S&P 500. Technology holdings and underweight, differentiated Energy exposure chiefly hurt relative performance. Strong large-cap technology performance partly offset volatility associated with Middle East conflict and rising interest rates.[1]
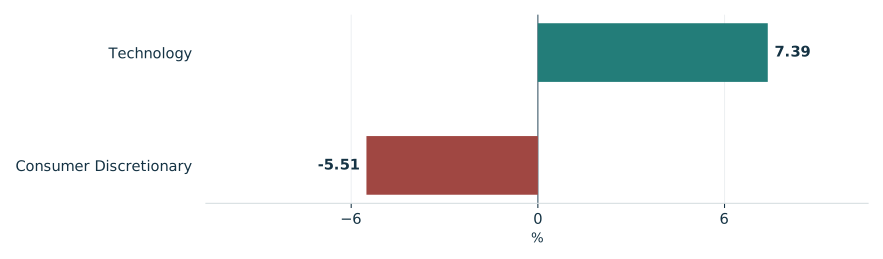
Invesco’s October 26 review showed stronger September performance: QQQ gained 3.28% at NAV versus the S&P 500’s 0.35% decline. Technology holdings and an overweight in that sector supported relative gains, while the Consumer Discretionary overweight was the largest relative detractor. The fund also experienced net outflows.[2]
QQQ’s September sector holdings diverged
Reported returns of selected QQQ sector holdings

View chart data & download
| Measure | Value | Period | Status |
|---|---|---|---|
| Technology | 7.39 | September 2026 | reported |
| Consumer Discretionary | -5.51 | September 2026 | reported |
What the six windows show
TradeWave’s selected study reports a 9.41% median full-window long result. That describes completed historical windows, not the return remaining today. Its latest trade observation is November 16, 2026, which cannot establish QQQ’s condition later in this underway window.[4]
The year-by-year seasonal record

View exact TradeWave observations and download
| Window starting year | Ending price change | Highest from entry | Lowest from entry |
|---|---|---|---|
| 2002 | +9.38% | +9.64% | -11.80% |
| 2006 | +4.71% | +6.68% | -4.53% |
| 2010 | +10.10% | +13.82% | -2.79% |
| 2014 | +7.12% | +8.67% | -3.09% |
| 2018 | +9.43% | +14.35% | -14.41% |
| 2022 | +13.37% | +13.50% | -10.03% |
Explore this exact seasonal window in TradeWave. Compare its win rate and average result across different histories, and inspect how far prices moved above or below their starting point. Account access applies in TradeWave.
A gain can include substantial losses
The yearly range chart covers the same seasonal period each year, not whole calendar years. November 15, 2018–May 15, 2019 shows why the ending return alone can understate the risk: QQQ finished up 9.43% but traded 14.41% below its starting price during the period. The highs and lows do not reveal their order or measure a peak-to-trough loss.[4]
What happened inside each seasonal window

View exact TradeWave observations and download
| Window starting year | Ending price change | Highest from entry | Lowest from entry |
|---|---|---|---|
| 2002 | +9.38% | +9.64% | -11.80% |
| 2006 | +4.71% | +6.68% | -4.53% |
| 2010 | +10.10% | +13.82% | -2.79% |
| 2014 | +7.12% | +8.67% | -3.09% |
| 2018 | +9.43% | +14.35% | -14.41% |
| 2022 | +13.37% | +13.50% | -10.03% |
Broader histories include losing windows
Checking across all years tests whether the favorable reading extends beyond midterms. Windows starting in 2016–2025 and 2006–2025 were both 90.0% profitable, tempering confidence in the six-window perfect record. These are not independent confirmations: the shorter history reuses 2018 and 2022; the longer reuses every selected year except 2002 and contains the shorter history.[4]
See the history behind this comparison
TradeWave checks the same seasonal dates across different sets of years. This helps show whether the pattern holds up when you look at another stretch of history.
| History | Observed start years | Direction | Success rate | Median result |
|---|---|---|---|---|
| Article study: 6 selected midterm-election years (2002–2022) | 2002, 2006, 2010, 2014, 2018, 2022 | long | 100.0% | 9.41% |
| 10 consecutive historical windows (2016–2025) | 2016, 2017, 2018, 2019, 2020, 2021, 2022, 2023, 2024, 2025 | long | 90.0% | 10.75% |
| 20 consecutive historical windows (2006–2025) | 2006, 2007, 2008, 2009, 2010, 2011, 2012, 2013, 2014, 2015, 2016, 2017, 2018, 2019, 2020, 2021, 2022, 2023, 2024, 2025 | long | 90.0% | 9.81% |
Some years appear in more than one group, so agreement is not an independent test. A requested lookback can extend beyond available history; the observed years are listed above. Election-cycle groups use matching phases, not consecutive years. Results follow the direction shown: a positive short result means prices fell. Small samples and different market periods make the comparison less conclusive.
NVIDIA’s November 17 report
The results and call scheduled for November 17, 2026 offer the next opportunity to hear how NVIDIA’s interim leadership plans to maintain operations and customer commitments.[3]
The price chart below places the engine’s seasonal overlay, using this article’s six selected midterm years, alongside recorded prices ending November 16, 2026. The overlay covers the next 60 weekdays, November 17, 2026–February 8, 2027, a separate horizon from the full seasonal window. It illustrates historical shape, without predicting earnings or a price target. In TradeWave, compare this same window across histories and inspect how far prices moved below their starting points even when they finished higher.[4]
Price history and the seasonal outlook

Explore this exact seasonal window in TradeWave. Compare its win rate and average result across different histories, and inspect how far prices moved above or below their starting point. Account access applies in TradeWave.
About this seasonal analysis
6 selected midterm-election years (2002–2022). The selected dates, years, direction, returns and ranges come from TradeWave. When a window boundary is a weekend or market holiday, TradeWave uses the next available trading session. SMN displays the returned results without recalculating them. A year label identifies the start of the historical window; a window can end in the following calendar year.
Green and red bars show the underlying adjusted-price movement. The range endpoints measure changes from the entry price, not a peak-to-trough loss. Historical results are before trading costs and do not guarantee future performance.
Sources & methodology
- QQQ quarterly outlook report · 2026-10-28
- Invesco QQQ monthly review · 2026-10-26
- NVIDIA Announces CEO Transition · 2026-11-12
- TradeWave QQQ seasonal evidence · 2026-11-17