
SPY investors face a question before December’s seasonal window: what will NVIDIA’s earnings reveal following Jensen Huang’s departure? NVIDIA announced his immediate resignation on November 12 and appointed CFO Colette Kress interim CEO, retaining both roles.[4][3]
TradeWave’s December 16–May 30 study finished higher in all seven selected midterm-election years spanning 1998–2022. That favorable record invites closer inspection ahead of December 16, 2026, but broader histories include losses, limiting the reassurance it offers.[4]
NVIDIA’s immediate checkpoint
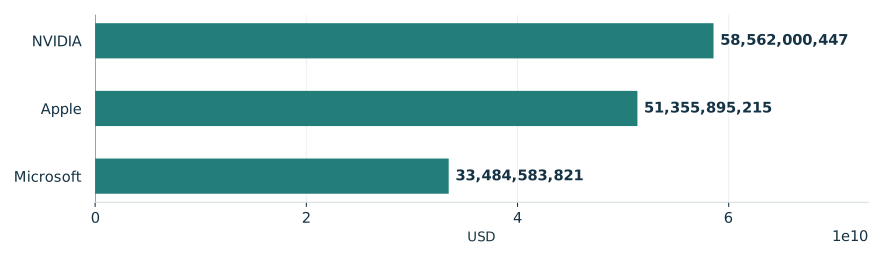
The State Street SPDR S&P 500 ETF Trust’s June 30, 2026 holdings report, filed August 28, listed $58,562,000,447 in NVIDIA shares, exceeding Apple or Microsoft. This snapshot establishes neither November 17 holdings nor December 16 exposure.[1]
On November 8, NVIDIA’s board announced an independent investigation following reports of a foreign intelligence effort targeting Huang. It said it had no reason to believe national security or company secrets were compromised; the inquiry remained open.[2]
The board expects uninterrupted operations, customer commitments and product plans; continuity remains an expectation. Fiscal 2027 third-quarter results were scheduled for approximately 1:20 p.m. PT November 17, followed by a 2 p.m. call. At the saved 09:26 UTC check, results were still forthcoming, with no outcome or market effect established.[3]
SPY’s reported holdings included a large NVIDIA position
Selected holdings in the June 30, 2026 unaudited schedule of investments

View chart data & download
| Measure | Value | Period | Status |
|---|---|---|---|
| NVIDIA | 58,562,000,447 | 2026-06-30 | reported |
| Apple | 51,355,895,215 | 2026-06-30 | reported |
| Microsoft | 33,484,583,821 | 2026-06-30 | reported |
Seven favorable midterm windows
TradeWave’s selected seasonal record has a 9.12% median full-window long result. It concerns the complete December 16–May 30 period, ending in the following year, not a return available from today.[4]
The year-by-year seasonal record

View exact TradeWave observations and download
| Window starting year | Ending price change | Highest from entry | Lowest from entry |
|---|---|---|---|
| 1998 | +11.98% | +19.10% | +0.00% |
| 2002 | +6.73% | +6.89% | -12.96% |
| 2006 | +8.55% | +8.59% | -3.66% |
| 2010 | +9.12% | +10.96% | -0.28% |
| 2014 | +7.97% | +9.10% | +0.00% |
| 2018 | +10.39% | +16.69% | -7.92% |
| 2022 | +10.05% | +10.68% | -2.22% |
Explore this exact seasonal window in TradeWave. Compare its win rate and average result across different histories, and inspect how far prices moved above or below their starting point. Account access applies in TradeWave.
What a positive ending concealed
The yearly range chart shows each year’s same seasonal period, not its whole calendar year. December 16, 2002–May 30, 2003 illustrates the distinction: SPY finished up 6.73% but reached 12.96% below the starting price. Those highs and lows reveal discomfort hidden by the ending return, without establishing their order, a peak-to-trough loss or a future stop.[4]
What happened inside each seasonal window

View exact TradeWave observations and download
| Window starting year | Ending price change | Highest from entry | Lowest from entry |
|---|---|---|---|
| 1998 | +11.98% | +19.10% | +0.00% |
| 2002 | +6.73% | +6.89% | -12.96% |
| 2006 | +8.55% | +8.59% | -3.66% |
| 2010 | +9.12% | +10.96% | -0.28% |
| 2014 | +7.97% | +9.10% | +0.00% |
| 2018 | +10.39% | +16.69% | -7.92% |
| 2022 | +10.05% | +10.68% | -2.22% |
Broader histories temper confidence
Checking across all years makes the perfect record less convincing: 2016–2025 windows were 70.0% profitable; 2006–2025 windows, 75.0%. Seven selected observations cannot establish an election effect. The shorter comparison reuses 2018 and 2022; the longer also reuses 2006, 2010 and 2014. The shorter history sits inside the longer, so agreement supplies limited independent confirmation.[4]
See the history behind this comparison
TradeWave checks the same seasonal dates across different sets of years. This helps show whether the pattern holds up when you look at another stretch of history.
| History | Observed start years | Direction | Success rate | Median result |
|---|---|---|---|---|
| Article study: 7 selected midterm-election years (1998–2022) | 1998, 2002, 2006, 2010, 2014, 2018, 2022 | long | 100.0% | 9.12% |
| 10 consecutive historical windows (2016–2025) | 2016, 2017, 2018, 2019, 2020, 2021, 2022, 2023, 2024, 2025 | long | 70.0% | 8.92% |
| 20 consecutive historical windows (2006–2025) | 2006, 2007, 2008, 2009, 2010, 2011, 2012, 2013, 2014, 2015, 2016, 2017, 2018, 2019, 2020, 2021, 2022, 2023, 2024, 2025 | long | 75.0% | 8.26% |
Some years appear in more than one group, so agreement is not an independent test. A requested lookback can extend beyond available history; the observed years are listed above. Election-cycle groups use matching phases, not consecutive years. Results follow the direction shown: a positive short result means prices fell. Small samples and different market periods make the comparison less conclusive.
From earnings to December
Inspect NVIDIA’s results next, then compare this window’s outcomes in TradeWave before December 16. The price illustration below uses the article’s seven selected midterm years and the engine’s seasonal overlay. Recorded prices end November 16, 2026; November 17–February 8, 2027 covers only the next 60 weekdays of historical illustration. That separate horizon ends before the full window’s May 30 close. It is neither an earnings prediction nor a price target.[4][3]
Price history and the seasonal outlook

Explore this exact seasonal window in TradeWave. Compare its win rate and average result across different histories, and inspect how far prices moved above or below their starting point. Account access applies in TradeWave.
About this seasonal analysis
7 selected midterm-election years (1998–2022). The selected dates, years, direction, returns and ranges come from TradeWave. When a window boundary is a weekend or market holiday, TradeWave uses the next available trading session. SMN displays the returned results without recalculating them. A year label identifies the start of the historical window; a window can end in the following calendar year.
Green and red bars show the underlying adjusted-price movement. The range endpoints measure changes from the entry price, not a peak-to-trough loss. Historical results are before trading costs and do not guarantee future performance.
Sources & methodology
- Quarterly Report · 2026-08-28
- Statement From NVIDIA Board of Directors · 2026-11-08
- NVIDIA Announces CEO Transition · 2026-11-12
- TradeWave SPY seasonal evidence · 2026-11-17