
Take-Two shareholders are about to see whether Grand Theft Auto VI can help the company meet its fiscal ambitions. Its November 9 release scheduled the game for November 19, 2026, placing launch reception ahead of December’s seasonal entry.[1][3]
For the December 1, 2026 to October 22, 2027 window, all six selected historical midterm windows finished higher, although broader histories include losses. That raises a practical timing question: how much confidence should investors place in this favorable seasonal record?[3]
What the launch must deliver
Take-Two common stock trades on Nasdaq as TTWO. For the quarter ended September 30, 2026, GAAP revenue fell to $1.50 billion from $1.77 billion a year earlier; the GAAP net loss narrowed to $54.0 million from $133.9 million.[1]
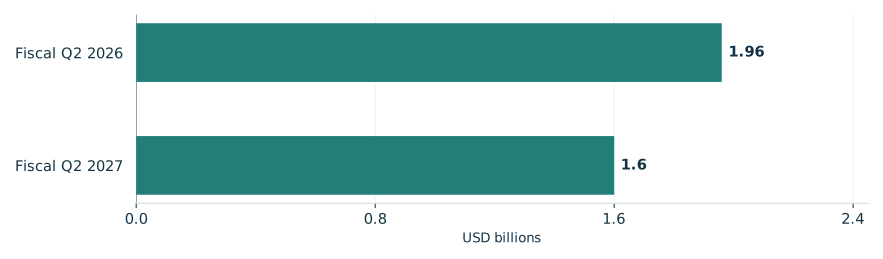
Net Bookings fell 18% to $1.60 billion from $1.96 billion in the comparable quarter. The captured release provides no specific explanation for the decline. Management characterized pre-orders as unprecedented, without reporting a sales total.[1]
Management reiterated fiscal 2027 Net Bookings guidance of $8.0–$8.2 billion, alongside forecast GAAP net income of $109–$142 million and non-GAAP EBITDA of $1.024–$1.082 billion. Fiscal third-quarter bookings guidance is $3.35–$3.50 billion. Dependencies include timely releases, market acceptance, platform and mobile performance, economic conditions and stable exchange rates.[1]
Take-Two’s reported quarterly Net Bookings declined
Fiscal second quarters ended September 30

View chart data & download
| Measure | Value | Period | Status |
|---|---|---|---|
| Fiscal Q2 2026 | 1.96 | Three months ended September 30, 2025 | reported |
| Fiscal Q2 2027 | 1.6 | Three months ended September 30, 2026 | reported |
A favorable selected record
TradeWave’s seasonal record supplies a 24.63% median full-window long result across six selected midterm-election start years spanning 2002–2022. These are completed, nonconsecutive observations. Their favorable results offer historical timing context, but six windows cannot establish a dependable gain or show that elections caused the advances.[3]
The year-by-year seasonal record

View exact TradeWave observations and download
| Window starting year | Ending price change | Highest from entry | Lowest from entry |
|---|---|---|---|
| 2002 | +33.11% | +44.34% | -36.61% |
| 2006 | +6.56% | +39.09% | -33.71% |
| 2010 | +26.56% | +54.62% | -6.51% |
| 2014 | +22.70% | +23.26% | -12.73% |
| 2018 | +17.91% | +31.16% | -18.41% |
| 2022 | +33.62% | +44.59% | -8.64% |
Explore this exact seasonal window in TradeWave. Compare its win rate and average result across different histories, and inspect how far prices moved above or below their starting point. Account access applies in TradeWave.
Winning finishes can conceal losses
The yearly range chart shows each year’s same seasonal period, not its whole calendar year. December 1, 2002 to October 22, 2003 is useful because its winning finish concealed a substantial decline: shares ended up 33.11% but traded 36.61% below the starting price. The highs and lows show what the ending return leaves out; they do not reveal the order of moves or a peak-to-trough drawdown.[3]
What happened inside each seasonal window

View exact TradeWave observations and download
| Window starting year | Ending price change | Highest from entry | Lowest from entry |
|---|---|---|---|
| 2002 | +33.11% | +44.34% | -36.61% |
| 2006 | +6.56% | +39.09% | -33.71% |
| 2010 | +26.56% | +54.62% | -6.51% |
| 2014 | +22.70% | +23.26% | -12.73% |
| 2018 | +17.91% | +31.16% | -18.41% |
| 2022 | +33.62% | +44.59% | -8.64% |
Broader histories temper confidence
Checking the same window across all years makes the six-midterm result less convincing: profitable windows were 80.0% for start years 2016–2025 and 75.0% for 2006–2025. The small selected sample therefore deserves caution. These comparisons reuse two and five selected study years respectively, and the shorter history sits entirely inside the longer one, limiting independent confirmation.[3]
See the history behind this comparison
TradeWave checks the same seasonal dates across different sets of years. This helps show whether the pattern holds up when you look at another stretch of history.
| History | Observed start years | Direction | Success rate | Median result |
|---|---|---|---|---|
| Article study: 6 selected midterm-election years (2002–2022) | 2002, 2006, 2010, 2014, 2018, 2022 | long | 100.0% | 24.63% |
| 10 consecutive historical windows (2016–2025) | 2016, 2017, 2018, 2019, 2020, 2021, 2022, 2023, 2024, 2025 | long | 80.0% | 13.36% |
| 20 consecutive historical windows (2006–2025) | 2006, 2007, 2008, 2009, 2010, 2011, 2012, 2013, 2014, 2015, 2016, 2017, 2018, 2019, 2020, 2021, 2022, 2023, 2024, 2025 | long | 75.0% | 13.36% |
Some years appear in more than one group, so agreement is not an independent test. A requested lookback can extend beyond available history; the observed years are listed above. Election-cycle groups use matching phases, not consecutive years. Results follow the direction shown: a positive short result means prices fell. Small samples and different market periods make the comparison less conclusive.
Reception first, then December
The next business question is whether launch reception supports management’s fiscal outlook.[1]
Recorded prices end November 16, 2026, before December’s entry. The following illustration uses this article’s six selected years and the engine’s normalized seasonal overlay for the next 60 weekdays, November 17, 2026 through February 8, 2027. It places historical shape alongside the price chart over a separate, shorter horizon. Those future dates belong only to the seasonal illustration, not recorded prices, an earnings prediction or a price target. Inspect TradeWave’s same-window comparisons and yearly ranges before judging the record’s dependability.[3]
Price history and the seasonal outlook

Explore this exact seasonal window in TradeWave. Compare its win rate and average result across different histories, and inspect how far prices moved above or below their starting point. Account access applies in TradeWave.
About this seasonal analysis
6 selected midterm-election years (2002–2022). The selected dates, years, direction, returns and ranges come from TradeWave. When a window boundary is a weekend or market holiday, TradeWave uses the next available trading session. SMN displays the returned results without recalculating them. A year label identifies the start of the historical window; a window can end in the following calendar year.
Green and red bars show the underlying adjusted-price movement. The range endpoints measure changes from the entry price, not a peak-to-trough loss. Historical results are before trading costs and do not guarantee future performance.
Sources & methodology
- Take-Two Interactive Software, Inc. Reports Results for Fiscal Second Quarter 2027 · 2026-11-09
- FORM 10-Q · 2026-11-09
- TradeWave TTWO seasonal evidence · 2026-11-17