
For GLD shareholders, October’s gold selloff raises a practical question: is a recovery becoming more plausible? The shares seek to reflect bullion prices less trust expenses.[3][1]
The December 14, 2026–January 31, 2027 window is still ahead. Nine gains in ten selected historical windows offer a favorable timing perspective, tempered by less consistent longer history.[4]
October’s recovery signal remains incomplete
The World Gold Council’s November 5 commentary reported gold at $3,913 per ounce at October’s end, down 6.3%. It cited likely contributions from repriced Federal Reserve expectations, reduced speculative exposure and rotation into bonds, even as lower yields supported gold.[3]
Indicators through October 28 met two recovery conditions: gold well below its 200-day average and a stronger dollar. Positioning, measured through October 27, remained elevated. The council’s small-sample framework concerns only three months and is not a trading rule or a GLD return forecast.[3]
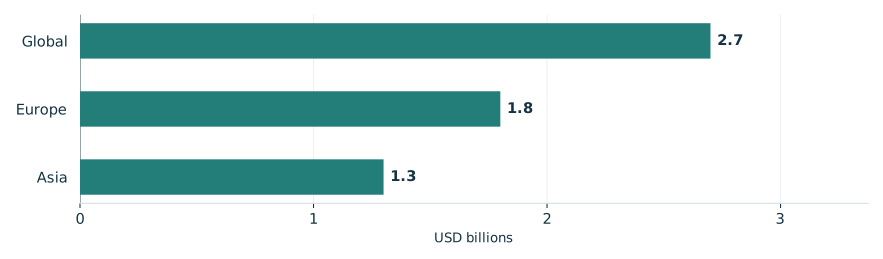
Its separate November 5 ETF report showed October global inflows of $2.7 billion and holdings up 19 tonnes, while falling gold prices cut assets under management 6%. Europe and Asia attracted inflows; North America had outflows. These global observations establish neither GLD-specific demand nor December conditions.[2]
October gold ETF inflows differed by region
Reported physically backed gold ETF flows, October 2026

View chart data & download
| Measure | Value | Period | Status |
|---|---|---|---|
| Global | 2.7 | October 2026 | reported |
| Europe | 1.8 | October 2026 | reported |
| Asia | 1.3 | October 2026 | reported |
A favorable seasonal record
TradeWave’s ten consecutive windows starting in 2016–2025 show a median full-window long result of 6.37%. That describes completed December-to-January periods before trading costs, not an expected gain from today or evidence that gold has bottomed.[4]
The year-by-year seasonal record

View exact TradeWave observations and download
| Window starting year | Ending price change | Highest from entry | Lowest from entry |
|---|---|---|---|
| 2016 | +6.17% | +6.74% | -1.68% |
| 2017 | +7.33% | +8.90% | +0.00% |
| 2018 | +6.57% | +6.98% | +0.00% |
| 2019 | +7.40% | +7.65% | -0.17% |
| 2020 | +1.57% | +6.80% | -0.33% |
| 2021 | +1.60% | +4.66% | -0.99% |
| 2022 | +6.73% | +7.80% | -1.78% |
| 2023 | -0.15% | +2.36% | -1.74% |
| 2024 | +5.59% | +6.17% | -2.51% |
| 2025 | +7.92% | +28.78% | -0.31% |
Explore this exact seasonal window in TradeWave. Compare its win rate and average result across different histories, and inspect how far prices moved above or below their starting point. Account access applies in TradeWave.
A gain can include uncomfortable losses
The yearly range chart covers the same seasonal period each year, not whole calendar years. December 14, 2024–January 31, 2025 illustrates why the finish can obscure discomfort: GLD gained 5.59% but also traded 2.51% below its starting price. The highs and lows reveal neither their order nor a peak-to-trough drawdown.[4]
What happened inside each seasonal window

View exact TradeWave observations and download
| Window starting year | Ending price change | Highest from entry | Lowest from entry |
|---|---|---|---|
| 2016 | +6.17% | +6.74% | -1.68% |
| 2017 | +7.33% | +8.90% | +0.00% |
| 2018 | +6.57% | +6.98% | +0.00% |
| 2019 | +7.40% | +7.65% | -0.17% |
| 2020 | +1.57% | +6.80% | -0.33% |
| 2021 | +1.60% | +4.66% | -0.99% |
| 2022 | +6.73% | +7.80% | -1.78% |
| 2023 | -0.15% | +2.36% | -1.74% |
| 2024 | +5.59% | +6.17% | -2.51% |
| 2025 | +7.92% | +28.78% | -0.31% |
Does broader history agree?
Checking consistency, the 2006–2025 windows remain favorable but show 80.0% profitable versus 90.0% for 2016–2025. Five selected midterm-election years spanning 2006–2022 also show 80.0%, offering limited confidence. The longer history includes the entire primary study; the midterm group reuses 2018 and 2022, so neither supplies independent confirmation or establishes an election effect.[4]
See the history behind this comparison
TradeWave checks the same seasonal dates across different sets of years. This helps show whether the pattern holds up when you look at another stretch of history.
| History | Observed start years | Direction | Success rate | Median result |
|---|---|---|---|---|
| Article study: 10 consecutive historical windows (2016–2025) | 2016, 2017, 2018, 2019, 2020, 2021, 2022, 2023, 2024, 2025 | long | 90.0% | 6.37% |
| 20 consecutive historical windows (2006–2025) | 2006, 2007, 2008, 2009, 2010, 2011, 2012, 2013, 2014, 2015, 2016, 2017, 2018, 2019, 2020, 2021, 2022, 2023, 2024, 2025 | long | 80.0% | 6.16% |
| 5 selected midterm-election years (2006–2022) | 2006, 2010, 2014, 2018, 2022 | long | 80.0% | 6.57% |
Some years appear in more than one group, so agreement is not an independent test. A requested lookback can extend beyond available history; the observed years are listed above. Election-cycle groups use matching phases, not consecutive years. Results follow the direction shown: a positive short result means prices fell. Small samples and different market periods make the comparison less conclusive.
What to inspect before December 14
Recorded GLD prices end November 18, 2026. The following chart adds the engine’s seasonal overlay using the selected 2016–2025 windows over the next 60 weekdays, November 19, 2026–February 10, 2027. This separate horizon illustrates historical shape, not future recorded prices or a price target.[4]
Before December 14, does speculative positioning ease? In TradeWave, compare this same window across histories and inspect the range of outcomes.[3][4]
Price history and the seasonal outlook

Explore this exact seasonal window in TradeWave. Compare its win rate and average result across different histories, and inspect how far prices moved above or below their starting point. Account access applies in TradeWave.
About this seasonal analysis
10 consecutive historical windows (2016–2025). The selected dates, years, direction, returns and ranges come from TradeWave. When a window boundary is a weekend or market holiday, TradeWave uses the next available trading session. SMN displays the returned results without recalculating them. A year label identifies the start of the historical window; a window can end in the following calendar year.
Green and red bars show the underlying adjusted-price movement. The range endpoints measure changes from the entry price, not a peak-to-trough loss. Historical results are before trading costs and do not guarantee future performance.
Sources & methodology
- FORM 10-Q · 2026-08-04
- Gold ETF Flows: October 2026 — Europe remains in driver's seat · 2026-11-05
- Gold Market Commentary: Where floor art thou? · 2026-11-05
- TradeWave GLD seasonal evidence · 2026-11-19