
Investors looking for relief from elevated volatility face a timely question: does VIX usually ease during this stretch of November? Cboe reported that the index fell to about 24.6 on November 18, leaving uncertainty over whether that easing would continue.[1]
TradeWave’s November 19–23 window begins with this edition. VIX declined in 10 of the 13 selected windows from 2013–2025, favoring the study’s short direction. Yet selected midterm-election years split evenly, weakening reassurance for 2026.[4]
Elevated, but not across every market
November 18’s reading remained above the 20 level Cboe associates with calm; it does not establish November 19 entry conditions.[1]
Cboe’s November 9 digest described technology-led equity turbulence while rates, commodities, credit and currency implied volatility declined. Changes in downside-protection pricing accounted for almost half an earlier VIX jump as hedging demand rose. That explanation concerns the earlier jump.[2]
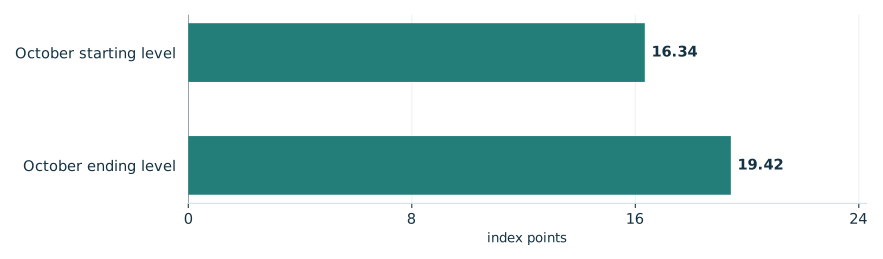
The accompanying chart supplies older context: Cboe’s November 3 review recorded October’s VIX rise from 16.34 to 19.42.[3]
VIX rose during October
Cboe-reported spot index levels

View chart data & download
| Measure | Value | Period | Status |
|---|---|---|---|
| October starting level | 16.34 | October 2026 starting level | reported |
| October ending level | 19.42 | October 2026 ending level | reported |
What the favorable record means
TradeWave’s seasonal record frames a tendency toward lower index levels over these five calendar days. Positive short-direction statistics describe declining VIX levels; the bars retain the actual index changes. Results cover complete windows, not the movement remaining after entry.[4]
VIX measures expected 30-day volatility using S&P 500 option prices. The spot index cannot be bought or shorted directly, so its percentage changes do not establish attainable futures, options or exchange-traded-product profits.[3]
The year-by-year seasonal record

View exact TradeWave observations and download
| Window starting year | Ending price change | Highest from entry | Lowest from entry |
|---|---|---|---|
| 2013 | -4.48% | +4.11% | -8.59% |
| 2014 | -9.60% | +12.75% | -10.96% |
| 2015 | -8.06% | +0.00% | -9.48% |
| 2016 | +0.08% | +4.75% | -1.85% |
| 2017 | -9.20% | +1.22% | -19.62% |
| 2018 | +7.06% | +18.46% | +0.00% |
| 2019 | -7.70% | +10.19% | -8.79% |
| 2020 | -1.95% | +3.68% | -4.24% |
| 2021 | +8.21% | +16.75% | -3.13% |
| 2022 | -8.99% | +1.57% | -9.12% |
| 2023 | -4.55% | +6.71% | -4.92% |
| 2024 | -10.70% | +14.92% | -11.07% |
| 2025 | -13.27% | +19.48% | -18.51% |
Explore this exact seasonal window in TradeWave. Compare its win rate and average result across different histories, and inspect how far prices moved above or below their starting point. Account access applies in TradeWave.
A lower finish can conceal a sharp rise
The yearly range chart shows each year’s same seasonal period, not the whole year. November 19–23, 2025 is useful because VIX finished down 13.27% yet reached 19.48% above its starting level. That separates the ending result from an adverse rise inside the window. The highs and lows reveal neither their order nor a peak-to-trough drawdown.[4]
What happened inside each seasonal window

View exact TradeWave observations and download
| Window starting year | Ending price change | Highest from entry | Lowest from entry |
|---|---|---|---|
| 2013 | -4.48% | +4.11% | -8.59% |
| 2014 | -9.60% | +12.75% | -10.96% |
| 2015 | -8.06% | +0.00% | -9.48% |
| 2016 | +0.08% | +4.75% | -1.85% |
| 2017 | -9.20% | +1.22% | -19.62% |
| 2018 | +7.06% | +18.46% | +0.00% |
| 2019 | -7.70% | +10.19% | -8.79% |
| 2020 | -1.95% | +3.68% | -4.24% |
| 2021 | +8.21% | +16.75% | -3.13% |
| 2022 | -8.99% | +1.57% | -9.12% |
| 2023 | -4.55% | +6.71% | -4.92% |
| 2024 | -10.70% | +14.92% | -11.07% |
| 2025 | -13.27% | +19.48% | -18.51% |
Less convincing further back
Checking broader history tests how much reassurance the selected record deserves. Across 2006–2025, the short-direction median was 4.52%, versus 7.7% for 2013–2025; all selected windows recur. Eight selected midterm years spanning 1994–2022 split evenly between rises and falls. That small sample weakens a directional reading, and reused observations from 2014, 2018 and 2022 limit independent confirmation.[4]
See the history behind this comparison
TradeWave checks the same seasonal dates across different sets of years. This helps show whether the pattern holds up when you look at another stretch of history.
| History | Observed start years | Direction | Success rate | Median result |
|---|---|---|---|---|
| Article study: 13 consecutive historical windows (2013–2025) | 2013, 2014, 2015, 2016, 2017, 2018, 2019, 2020, 2021, 2022, 2023, 2024, 2025 | short | 76.92% | 7.7% |
| 20 consecutive historical windows (2006–2025) | 2006, 2007, 2008, 2009, 2010, 2011, 2012, 2013, 2014, 2015, 2016, 2017, 2018, 2019, 2020, 2021, 2022, 2023, 2024, 2025 | short | 70.0% | 4.52% |
| 8 selected midterm-election years (1994–2022) | 1994, 1998, 2002, 2006, 2010, 2014, 2018, 2022 | long | 50.0% | -0.97% |
Some years appear in more than one group, so agreement is not an independent test. A requested lookback can extend beyond available history; the observed years are listed above. Election-cycle groups use matching phases, not consecutive years. Results follow the direction shown: a positive short result means prices fell. Small samples and different market periods make the comparison less conclusive.
Watch the window, inspect the range
Does VIX ease through November 23? Inspect this same window’s outcomes in TradeWave. Below, recorded index levels end November 18, 2026. The engine’s rescaled seasonal overlay uses this article’s 2013–2025 years to illustrate historical shape over the next 60 weekdays, November 19, 2026–February 10, 2027. That separate horizon extends beyond the five-day study; it is neither future recorded data nor a forecast or target.[4]
Price history and the seasonal outlook

Explore this exact seasonal window in TradeWave. Compare its win rate and average result across different histories, and inspect how far prices moved above or below their starting point. Account access applies in TradeWave.
About this seasonal analysis
13 consecutive historical windows (2013–2025). The selected dates, years, direction, returns and ranges come from TradeWave. When a window boundary is a weekend or market holiday, TradeWave uses the next available trading session. SMN displays the returned results without recalculating them. A year label identifies the start of the historical window; a window can end in the following calendar year.
Green and red bars show the underlying adjusted-price movement. The range endpoints measure changes from the entry price, not a peak-to-trough loss. Historical results are before trading costs and do not guarantee future performance.
Sources & methodology
- Nasdaq Breaks Losing Streak as Dow and S&P Slide Again · 2026-11-18
- Week of 11/9/2026: No Contagion (Yet): Equity Vol Spikes, Macro Vol Fades · 2026-11-09
- Index Insights: October 2026 · 2026-11-03
- TradeWave VIX seasonal evidence · 2026-11-19