For corn futures investors, USDA’s lower output outlook raises a practical question: how much support can a smaller crop offer when projected feed-grain production remains historically large?[1]
The approaching November 29–December 23, 2026 window adds a timing question. That seasonal period finished higher in all ten selected years, 2016–2025, although longer history includes a loss. Can this favorable tendency persist against the current supply backdrop?[4]
Lower output, substantial supply
ERS’s November 16 outlook cut 2026/27 U.S. corn production by 3.6 million metric tons to 403.7 million, entirely because of lower estimated yields. Corn yield fell 1.6 bushels per acre to 179.6. Projected feed-grain production nevertheless remained the second largest on record.[1]
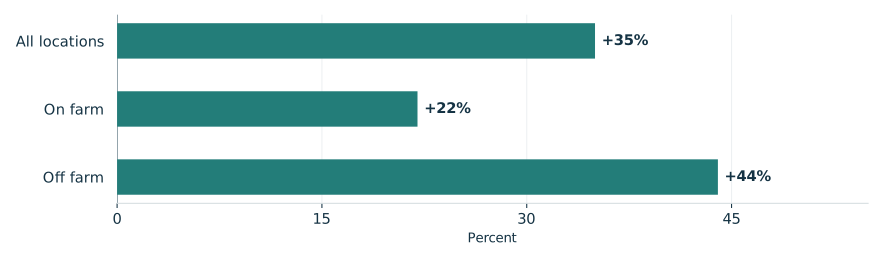
NASS reported September 30 that September 1 old-crop corn stocks totaled 2.10 billion bushels, up 35% from September 1, 2025. That inventory cushion tempers a simple scarcity reading.[2]
Separately, NASS’s October 24 notice identified a September processing error affecting yield forecasts, including the U.S. figure. Its review left October yield and production forecasts unchanged.[3]
Old-crop corn stocks rose across storage locations
September 1, 2026 versus September 1, 2025

View chart data & download
| Measure | Value | Period | Status |
|---|---|---|---|
| All locations | +35% | September 1, 2026 versus September 1, 2025 | reported |
| On farm | +22% | September 1, 2026 versus September 1, 2025 | reported |
| Off farm | +44% | September 1, 2026 versus September 1, 2025 | reported |
What the winning finishes establish
TradeWave’s selected seasonal record puts the median full-window long result at 4.48%, before trading costs. Consistent positive finishes make these dates worth examining; they do not establish an expected return from November 19 or validate the production outlook.[4]
The year-by-year seasonal record

View exact TradeWave observations and download
| Window starting year | Ending price change | Highest from entry | Lowest from entry |
|---|---|---|---|
| 2016 | +2.67% | +7.80% | -1.71% |
| 2017 | +4.06% | +4.20% | -1.11% |
| 2018 | +4.86% | +6.94% | +0.00% |
| 2019 | +4.71% | +5.19% | -3.84% |
| 2020 | +6.55% | +7.15% | -2.56% |
| 2021 | +4.26% | +4.48% | -3.27% |
| 2022 | +0.08% | +0.30% | -6.42% |
| 2023 | +6.78% | +7.62% | +0.00% |
| 2024 | +5.85% | +5.97% | -0.65% |
| 2025 | +3.41% | +3.76% | -1.04% |
Explore this exact seasonal window in TradeWave. Compare its win rate and average result across different histories, and inspect how far prices moved above or below their starting point. Account access applies in TradeWave.
A positive finish can hide discomfort
The yearly range chart shows each year’s same seasonal period, not the whole calendar year. November 29–December 23, 2022 is useful because its 0.08% gain concealed a move 6.42% below the starting price. The highs and lows show what a finishing return misses, without revealing their order or measuring a peak-to-trough loss.[4]
What happened inside each seasonal window

View exact TradeWave observations and download
| Window starting year | Ending price change | Highest from entry | Lowest from entry |
|---|---|---|---|
| 2016 | +2.67% | +7.80% | -1.71% |
| 2017 | +4.06% | +4.20% | -1.11% |
| 2018 | +4.86% | +6.94% | +0.00% |
| 2019 | +4.71% | +5.19% | -3.84% |
| 2020 | +6.55% | +7.15% | -2.56% |
| 2021 | +4.26% | +4.48% | -3.27% |
| 2022 | +0.08% | +0.30% | -6.42% |
| 2023 | +6.78% | +7.62% | +0.00% |
| 2024 | +5.85% | +5.97% | -0.65% |
| 2025 | +3.41% | +3.76% | -1.04% |
Does broader history agree?
Other histories check whether the favorable reading survives a different selection: 19 of 20 windows in 2006–2025 gained, while all six selected midterm-election years spanning 2002–2022 gained. Agreement supports the reading, but the longer set contains the entire primary sample and midterms reuse 2018 and 2022. The small midterm sample offers limited independent confirmation, not evidence of an election cause.[4]
See the history behind this comparison
TradeWave checks the same seasonal dates across different sets of years. This helps show whether the pattern holds up when you look at another stretch of history.
| History | Observed start years | Direction | Success rate | Median result |
|---|---|---|---|---|
| Article study: 10 consecutive historical windows (2016–2025) | 2016, 2017, 2018, 2019, 2020, 2021, 2022, 2023, 2024, 2025 | long | 100.0% | 4.48% |
| 20 consecutive historical windows (2006–2025) | 2006, 2007, 2008, 2009, 2010, 2011, 2012, 2013, 2014, 2015, 2016, 2017, 2018, 2019, 2020, 2021, 2022, 2023, 2024, 2025 | long | 95.0% | 4.42% |
| 6 selected midterm-election years (2002–2022) | 2002, 2006, 2010, 2014, 2018, 2022 | long | 100.0% | 4.28% |
Some years appear in more than one group, so agreement is not an independent test. A requested lookback can extend beyond available history; the observed years are listed above. Election-cycle groups use matching phases, not consecutive years. Results follow the direction shown: a positive short result means prices fell. Small samples and different market periods make the comparison less conclusive.
Reassess at the window’s start
November 29 is the next seasonal checkpoint; earlier observations cannot establish entry conditions. In TradeWave, inspect this window’s range of outcomes across histories. The price illustration below uses the selected 2016–2025 years and the engine’s seasonal overlay for the next 60 weekdays, November 19, 2026–February 10, 2027. Recorded prices end November 18. That separate horizon illustrates historical shape beyond the December 23 window end; it is not a forecast or price target.[4]
Price history and the seasonal outlook

Explore this exact seasonal window in TradeWave. Compare its win rate and average result across different histories, and inspect how far prices moved above or below their starting point. Account access applies in TradeWave.
About this seasonal analysis
10 consecutive historical windows (2016–2025). The selected dates, years, direction, returns and ranges come from TradeWave. When a window boundary is a weekend or market holiday, TradeWave uses the next available trading session. SMN displays the returned results without recalculating them. A year label identifies the start of the historical window; a window can end in the following calendar year.
Green and red bars show the underlying adjusted-price movement. The range endpoints measure changes from the entry price, not a peak-to-trough loss. Historical results are before trading costs and do not guarantee future performance.
Sources & methodology
- Corn and Other Feed Grains - Market Outlook · 2026-11-16
- US corn ending stocks up 35% from last year, soybean ending stocks down 3% · 2026-09-30
- Additional Information Regarding September Crop Production Notice · 2026-10-24
- TradeWave ZC seasonal evidence · 2026-11-19