
Cisco’s raised AI outlook gives shareholders more growth to look for. Can the company deliver while preserving profitability?[1]
For this November 20 edition, the November 21, 2026–February 1, 2027 window is approaching. All ten selected historical windows finished higher, although the longer history includes four losses. That makes the timing encouraging, with limits worth examining before treating the record as dependable.[3]
Growth and margin pressure
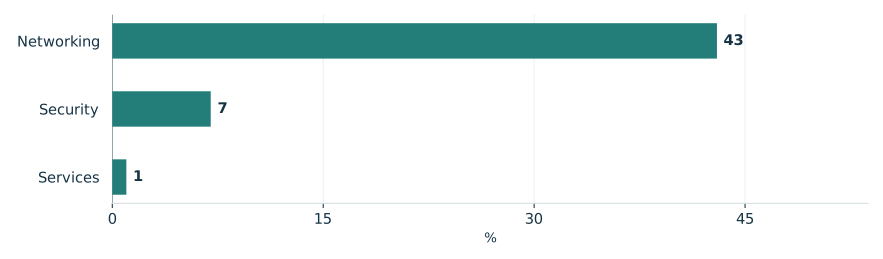
Cisco’s November 12 release reported fiscal Q1 2027 revenue of $18.5 billion, up 24%, for the quarter ended October 24, versus $14.9 billion a year earlier. GAAP/non-GAAP EPS reached $1.14/$1.40 versus $0.72/$1.00. Networking grew 43%; services grew 1%. Total and product gross margins declined on both accounting bases.[1]
Management credited broad demand, focused execution and operating efficiency. Customers sought to scale, secure and optimize AI environments; management said greater operating scale helped earnings grow faster than revenue.[1]
Management forecasts Q2 revenue of $18.0–$18.2 billion and GAAP/non-GAAP EPS of $1.07–$1.09/$1.34–$1.36. Fiscal 2027 forecasts are $74.8–$75.8 billion revenue and $4.38–$4.44/$5.47–$5.53 EPS, respectively. Its raised $9 billion hyperscaler AI infrastructure revenue expectation exceeds twice fiscal 2026’s total; it remains a forecast.[1]
Cisco’s first-quarter revenue growth varied by business
Fiscal 2027 first quarter; year-over-year changes

View chart data & download
| Measure | Value | Period | Status |
|---|---|---|---|
| Networking | 43 | Q1 FY2027 | reported |
| Security | 7 | Q1 FY2027 | reported |
| Services | 1 | Q1 FY2027 | reported |
Ten positive seasonal windows
TradeWave’s selected seasonal record covers ten consecutive windows starting in 2016–2025. The median full-window gain was 6.04%. The chart shows consistent positive endings, not an expected return for the approaching window.[3]
The year-by-year seasonal record

View exact TradeWave observations and download
| Window starting year | Ending price change | Highest from entry | Lowest from entry |
|---|---|---|---|
| 2016 | +2.37% | +4.22% | -3.09% |
| 2017 | +14.63% | +18.15% | -0.90% |
| 2018 | +6.27% | +9.47% | -10.34% |
| 2019 | +4.53% | +11.29% | -3.21% |
| 2020 | +9.91% | +12.48% | +0.00% |
| 2021 | +2.01% | +17.75% | -1.53% |
| 2022 | +2.81% | +6.49% | -3.33% |
| 2023 | +5.80% | +10.94% | -0.44% |
| 2024 | +6.77% | +9.01% | -0.50% |
| 2025 | +6.53% | +7.22% | -3.82% |
Explore this exact seasonal window in TradeWave. Compare its win rate and average result across different histories, and inspect how far prices moved above or below their starting point. Account access applies in TradeWave.
Winning endings can conceal losses
The yearly range chart covers the same seasonal period each year, not whole calendar years. November 21, 2018–February 1, 2019 is useful because a 6.27% ending gain coexisted with a move 10.34% below the starting price. Highs and lows reveal the range endured, not their order, peak-to-trough loss or a future stop level.[3]
What happened inside each seasonal window

View exact TradeWave observations and download
| Window starting year | Ending price change | Highest from entry | Lowest from entry |
|---|---|---|---|
| 2016 | +2.37% | +4.22% | -3.09% |
| 2017 | +14.63% | +18.15% | -0.90% |
| 2018 | +6.27% | +9.47% | -10.34% |
| 2019 | +4.53% | +11.29% | -3.21% |
| 2020 | +9.91% | +12.48% | +0.00% |
| 2021 | +2.01% | +17.75% | -1.53% |
| 2022 | +2.81% | +6.49% | -3.33% |
| 2023 | +5.80% | +10.94% | -0.44% |
| 2024 | +6.77% | +9.01% | -0.50% |
| 2025 | +6.53% | +7.22% | -3.82% |
Further back, less convincing
Checking persistence across all years, the 2006–2025 windows had a 3.67% median gain versus 6.04% for 2016–2025, while reusing the entire primary sample. The eight selected midterm-election years spanning 1994–2022 had a 75.0% success rate. This remains favorable but less dependable; the small midterm sample reuses 2018 and 2022, limiting independent confirmation and establishing no election cause.[3]
See the history behind this comparison
TradeWave checks the same seasonal dates across different sets of years. This helps show whether the pattern holds up when you look at another stretch of history.
| History | Observed start years | Direction | Success rate | Median result |
|---|---|---|---|---|
| Article study: 10 consecutive historical windows (2016–2025) | 2016, 2017, 2018, 2019, 2020, 2021, 2022, 2023, 2024, 2025 | long | 100.0% | 6.04% |
| 20 consecutive historical windows (2006–2025) | 2006, 2007, 2008, 2009, 2010, 2011, 2012, 2013, 2014, 2015, 2016, 2017, 2018, 2019, 2020, 2021, 2022, 2023, 2024, 2025 | long | 80.0% | 3.67% |
| 8 selected midterm-election years (1994–2022) | 1994, 1998, 2002, 2006, 2010, 2014, 2018, 2022 | long | 75.0% | 3.4% |
Some years appear in more than one group, so agreement is not an independent test. A requested lookback can extend beyond available history; the observed years are listed above. Election-cycle groups use matching phases, not consecutive years. Results follow the direction shown: a positive short result means prices fell. Small samples and different market periods make the comparison less conclusive.
Inspect the path and delivery
The next business question is whether Cisco delivers its raised outlook without further gross-margin erosion.[1]
Below, recorded prices end November 19, 2026, before entry. The engine’s normalized seasonal overlay uses this article’s 2016–2025 years for the next 60 weekdays, November 20–February 11, 2027, a separate horizon from the full window. It illustrates historical shape, not future recorded prices, an earnings prediction or a price target. In TradeWave, compare this same window across histories and inspect its ranges.[3]
Price history and the seasonal outlook

Explore this exact seasonal window in TradeWave. Compare its win rate and average result across different histories, and inspect how far prices moved above or below their starting point. Account access applies in TradeWave.
About this seasonal analysis
10 consecutive historical windows (2016–2025). The selected dates, years, direction, returns and ranges come from TradeWave. When a window boundary is a weekend or market holiday, TradeWave uses the next available trading session. SMN displays the returned results without recalculating them. A year label identifies the start of the historical window; a window can end in the following calendar year.
Green and red bars show the underlying adjusted-price movement. The range endpoints measure changes from the entry price, not a peak-to-trough loss. Historical results are before trading costs and do not guarantee future performance.
Sources & methodology
- CISCO REPORTS FIRST QUARTER EARNINGS · 2026-11-12
- Cisco Advances Scalability and Openness at OCP 2026 · 2026-10-12
- TradeWave CSCO seasonal evidence · 2026-11-20