Merck investors have an approval and an application withdrawal to weigh before earnings. What do these mixed developments establish about the business as a historically favorable period for its shares approaches?[3][4][2]
The next seasonal window runs November 10–December 5, 2026. Historical windows on those seasonal dates finished higher in all 10 selected midterm years from 1986–2022. The broader 2016–2025 and 2006–2025 histories include losses, raising the question of how much confidence that favorable selected record deserves.[5]
What the drug updates establish
Merck’s October 1 notice schedules its third-quarter 2026 sales and earnings call for October 29 at 9:00 a.m. ET, before the seasonal window. It supplies neither quarterly results nor a financial forecast.[2]
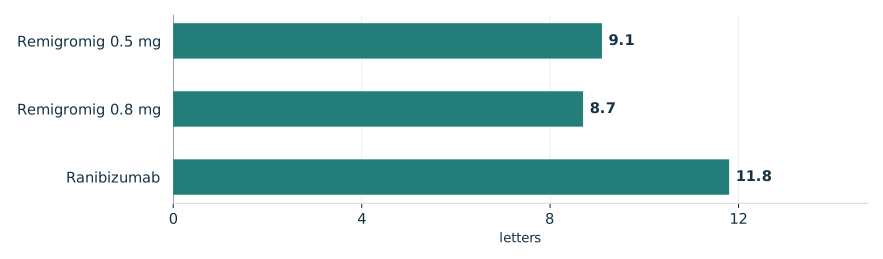
October 10’s BRUNELLO results showed one-year vision gains of 9.1 and 8.7 letters for the two remigromig doses versus 11.8 for ranibizumab. Both met the prespecified non-inferiority standard; no secondary endpoint showed superiority. Proliferative diabetic retinopathy events and adverse-event discontinuations were more frequent with remigromig. Merck said those retinopathy cases were generally manageable. Further analyses, evaluation and regulatory discussions remain ahead.[1]
On September 25, Merck and Daiichi Sankyo withdrew ifinatamab deruxtecan’s accelerated-approval application for previously treated extensive-stage small cell lung cancer. FDA discussions indicated that supporting data did not satisfy accelerated-approval requirements. Phase 3 enrollment continued.[3]
Reported one-year vision gains in BRUNELLO
Mean change in best-corrected visual acuity by treatment arm

View chart data & download
| Measure | Value | Period | Status |
|---|---|---|---|
| Remigromig 0.5 mg | 9.1 | BRUNELLO Year 1 | reported |
| Remigromig 0.8 mg | 8.7 | BRUNELLO Year 1 | reported |
| Ranibizumab | 11.8 | BRUNELLO Year 1 | reported |
A favorable selected history
TradeWave’s selected midterm study supplies timing context: the median full-window long result was 5.48%. These are scattered election-phase observations, not consecutive years. Their consistency does not establish that elections caused the gains or that the same result will recur.[5]
The year-by-year seasonal record

View exact TradeWave observations and download
| Window starting year | Ending price change | Highest from entry | Lowest from entry |
|---|---|---|---|
| 1986 | +7.31% | +8.48% | -6.07% |
| 1990 | +5.69% | +5.85% | -0.46% |
| 1994 | +2.17% | +2.85% | -4.04% |
| 1998 | +7.78% | +8.90% | -2.77% |
| 2002 | +8.30% | +9.90% | -5.87% |
| 2006 | +5.26% | +6.45% | +0.00% |
| 2010 | +0.83% | +1.97% | -2.92% |
| 2014 | +4.56% | +5.03% | -0.07% |
| 2018 | +4.93% | +7.36% | -2.09% |
| 2022 | +7.97% | +8.92% | -4.48% |
Explore this exact seasonal window in TradeWave. Compare its win rate and average result across different histories, and inspect how far prices moved above or below their starting point. Account access applies in TradeWave.
Winning windows still fell
The yearly range chart shows each year’s same seasonal period, not its whole calendar year. November 10–December 5, 2022 is useful because its 7.97% ending gain coexisted with a move 4.48% below the starting price. A favorable finish therefore conceals risk endured within the window. The highs and lows reveal neither their order nor peak-to-trough losses, and provide no stop or forecast.[5]
What happened inside each seasonal window

View exact TradeWave observations and download
| Window starting year | Ending price change | Highest from entry | Lowest from entry |
|---|---|---|---|
| 1986 | +7.31% | +8.48% | -6.07% |
| 1990 | +5.69% | +5.85% | -0.46% |
| 1994 | +2.17% | +2.85% | -4.04% |
| 1998 | +7.78% | +8.90% | -2.77% |
| 2002 | +8.30% | +9.90% | -5.87% |
| 2006 | +5.26% | +6.45% | +0.00% |
| 2010 | +0.83% | +1.97% | -2.92% |
| 2014 | +4.56% | +5.03% | -0.07% |
| 2018 | +4.93% | +7.36% | -2.09% |
| 2022 | +7.97% | +8.92% | -4.48% |
Broader histories temper confidence
The consecutive 2016–2025 and 2006–2025 comparisons check whether the favorable reading extends beyond the small selected midterm sample. Both show 80.0% profitable windows, tempering confidence in an unbroken winning record; the longer comparison’s median is 3.32%. They reuse, respectively, the selected 2018 and 2022 observations and the selected midterms from 2006–2022. The shorter comparison also sits inside the longer, limiting independent confirmation.[5]
See the history behind this comparison
TradeWave checks the same seasonal dates across different sets of years. This helps show whether the pattern holds up when you look at another stretch of history.
| History | Observed start years | Direction | Success rate | Median result |
|---|---|---|---|---|
| Article study: 10 selected midterm-election years (1986–2022) | 1986, 1990, 1994, 1998, 2002, 2006, 2010, 2014, 2018, 2022 | long | 100.0% | 5.48% |
| 10 consecutive historical windows (2016–2025) | 2016, 2017, 2018, 2019, 2020, 2021, 2022, 2023, 2024, 2025 | long | 80.0% | 3.78% |
| 20 consecutive historical windows (2006–2025) | 2006, 2007, 2008, 2009, 2010, 2011, 2012, 2013, 2014, 2015, 2016, 2017, 2018, 2019, 2020, 2021, 2022, 2023, 2024, 2025 | long | 80.0% | 3.32% |
Some years appear in more than one group, so agreement is not an independent test. A requested lookback can extend beyond available history; the observed years are listed above. Election-cycle groups use matching phases, not consecutive years. Results follow the direction shown: a positive short result means prices fell. Small samples and different market periods make the comparison less conclusive.
From earnings to November
The following price chart uses this article’s selected midterm years for a normalized average seasonal path over the next 60 weekdays, October 16, 2026–January 7, 2027. Scaled onto the price chart, it illustrates historical shape over a separate horizon from the full seasonal window. It predicts neither earnings nor a price target. Recorded prices end October 15, 2026; future illustration dates are not observations or known November starting conditions.[5]
October 29 is the next opportunity to assess business performance. Before November entry, readers can inspect this same window across TradeWave’s supplied histories and compare winning finishes with the range of moves experienced along the way.[2][5]
Price history and the seasonal outlook

Explore this exact seasonal window in TradeWave. Compare its win rate and average result across different histories, and inspect how far prices moved above or below their starting point. Account access applies in TradeWave.
About this seasonal analysis
10 selected midterm-election years (1986–2022). The selected dates, years, direction, returns and ranges come from TradeWave. When a window boundary is a weekend or market holiday, TradeWave uses the next available trading session. SMN displays the returned results without recalculating them. A year label identifies the start of the historical window; a window can end in the following calendar year.
Green and red bars show the underlying adjusted-price movement. The range endpoints measure changes from the entry price, not a peak-to-trough loss. Historical results are before trading costs and do not guarantee future performance.
Sources & methodology
- Merck Presents One-Year Results from the Pivotal Phase 2b/3 BRUNELLO Study Evaluating Remigromig, a Tri-specific Agonist of the Wingless-related Integration Site (Wnt) Pathway, in Adults with Diabetic Macular Edema at AAO 2026 · 2026-10-10
- Merck to Hold Third-Quarter 2026 Sales and Earnings Conference Call Oct. 29 · 2026-10-01
- Ifinatamab Deruxtecan Biologics License Application for Certain Patients with Previously Treated Extensive-Stage Small Cell Lung Cancer Voluntarily Withdrawn · 2026-09-25
- U.S. FDA Approves WELIREG® (belzutifan) Plus LENVIMA® (lenvatinib) for Certain Previously Treated Adult Patients With Advanced Renal Cell Carcinoma With a Clear Cell Component (ccRCC) · 2026-09-25
- TradeWave MRK seasonal evidence · 2026-10-16