Record US Corn (CME) (ZC) Exports Meet a High-Win Midterm Spring Window
Corn (CME) futures are jumping as a high-win-rate midterm-election-year spring window opens, colliding with shifting supply expectations and still-bearish speculative positioning.
Key takeaways
- A 62-day midterm-election-year window that began Mar 10 has historically been favorable for long Corn (CME) exposure.
- Across the last 6 midterm election years, Corn (CME) finished this window higher in 5 years and lower in 1 year, an 83% win rate for longs.
- Average gain in winning years was 3.16%, while the all-years average including the lone loser still comes in at 3%.
- Intraperiod swings have been meaningful, with several years showing strong rallies but also drawdowns of roughly 4% to 6% before recovering.
- Today’s 3.7% jump to 452.5 leaves ZC about 7.8% below its 52-week high and roughly 22.7% above its 52-week low, underscoring a rebound from last year’s trough.
- Speculators remain net bearish on grains but less so than last year, setting up a potential squeeze if the seasonal pattern repeats.[2]
According to historical data from TradeWave.ai, this midterm-election-year spring stretch in corn has behaved differently from an average month on the calendar, and the current window is already in motion.
Seasonal window
Corn (CME) has risen in 5 of the last 6 midterm election years during this 62-day window, averaging 3.16% gains for the winning years. The current iteration started on Mar 10 and arrives with ZC trading at 452.5, about 7.8% below its 52-week high of 490.75 and roughly 22.7% above its 52-week low of 368.75. That combination of a historically friendly calendar phase and a market still well off its highs gives this window more bite than a routine seasonal blip.
This pattern groups only midterm election years, not consecutive calendar years, which matters for corn because policy and trade flows often shift with the political cycle. The last six midterm years in the sample span 2002, 2006, 2010, 2014, 2018 and 2022, a period that captured very different weather, demand and rate environments but still produced a consistent spring bias to the upside for this contract.
The trade direction for this setup is long. Across those six midterm-year windows, Corn (CME) finished higher in 5 years and lower in 1 year, for an 83% Percent Profitable reading with 5 winners and 1 loser. Average winner gains of 3.16% compare with an all-years average of 3%, which means the single losing year was modest enough that it did not drag the overall result much below the winners-only figure.
Avg Profit reflects winners only, while Avg Profit - All includes every year in the sample. In this case, the small gap between 3.16% and 3% shows that the downside year was contained relative to the typical winning move, which is unusual for a commodity that often trades with sharp weather or policy shocks.
Intraperiod swings have still been meaningful. In 2014, the best year in the sample, Corn (CME) gained 5.4% over the window, with a maximum favorable move of 10.06% from the entry and a shallow maximum adverse move of just 0.79%. At the other end of the spectrum, 2002 finished down only 0.37% but saw a worst drawdown of 4.7% from the entry before stabilizing, a reminder that even “small” losing years have carried real downside air pockets.
The 2022 midterm year shows how volatile this stretch can be when macro stress is high. Corn (CME) ended that window up 3.79%, but the best intraperiod run-up reached 9.14% while the worst drawdown hit 5.84% from the starting level. That profile of large maximum favorable and large maximum adverse excursions is classic commodity behavior: the window has tended to reward patience in the trade direction, but only after surviving some uncomfortable swings.
Across the full sample, the TradeWave Ratio (TWR) prints at 2.13. TradeWave Ratio (TWR) reflects how far price typically travels in the trade direction within the window regardless of the final close. A reading above 2 in a 62-day futures window signals that when the pattern works, it often delivers a meaningful directional push rather than a slow grind.
The Sharpe ratio for this pattern is 0.98, based on end-of-window outcomes. For a commodity contract that trades on weather, geopolitics and policy, a risk-adjusted profile near 1.0 over a two-month slice is notable. It suggests that the historical upside has not come purely from a few outlier years but from a reasonably consistent tilt across cycles.
Trend metrics inside the window lean heavily to the long side. The “Trend Long” score of 72 and “Trend Long1” of 35, with zero readings on the short side, indicate that price has tended to spend more days grinding higher than lower during this stretch, even in years where the final net move was modest. That matches the per-year paths, where rallies often built in steps rather than in a single spike.
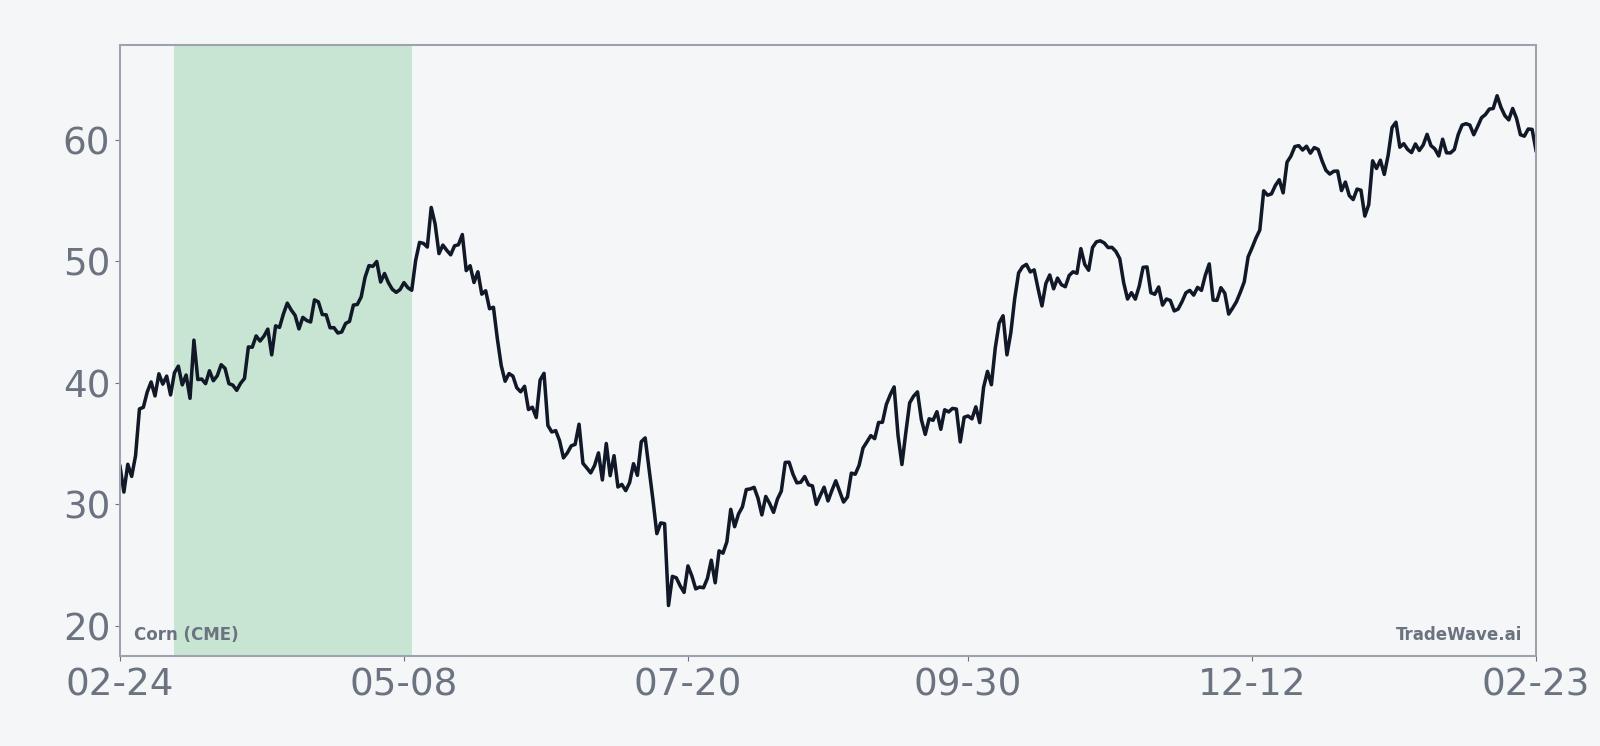
The cumulative return chart for this window shows a steady climb rather than a jagged sawtooth. Gains have tended to accrue through the middle of the window, with some years front-loading the move and others finishing stronger, but the multi-year average path slopes upward for most of the 62 days. There is no obvious “cliff” where the pattern suddenly reverses, which is important for traders who cannot time entries to the day.
Year-by-year bars with maximum favorable and adverse moves show how often rallies have come with sizable drawdowns.
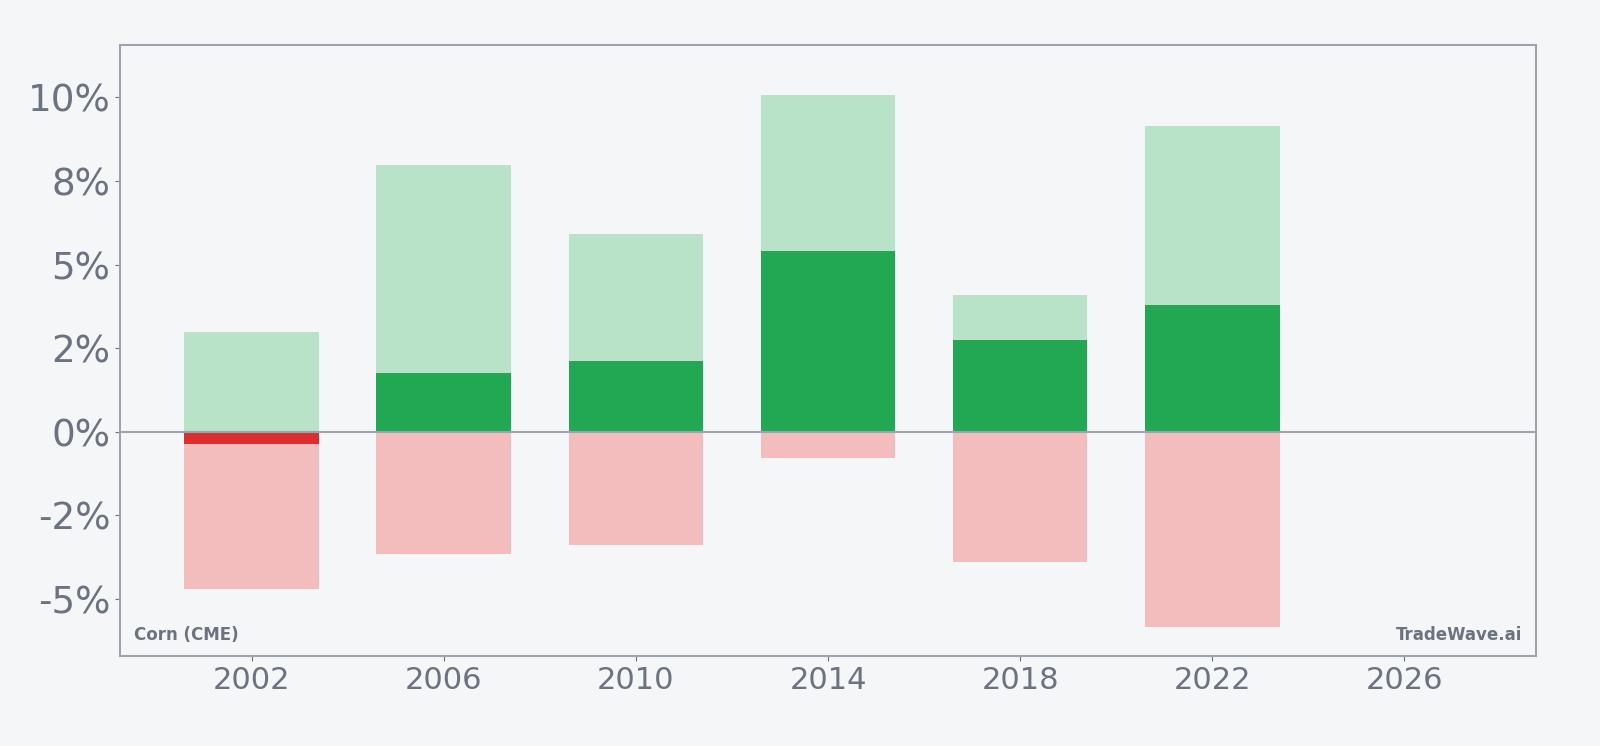
History does not guarantee future results, and worst-case intraperiod drawdowns have approached 6% even in windows that ultimately finished higher.
Put together, the pattern is clear: in the last six midterm election years, this specific 62-day stretch has favored long corn positions far more often than not, with meaningful rallies that have usually outweighed the drawdowns along the way.
Price and near-term drivers
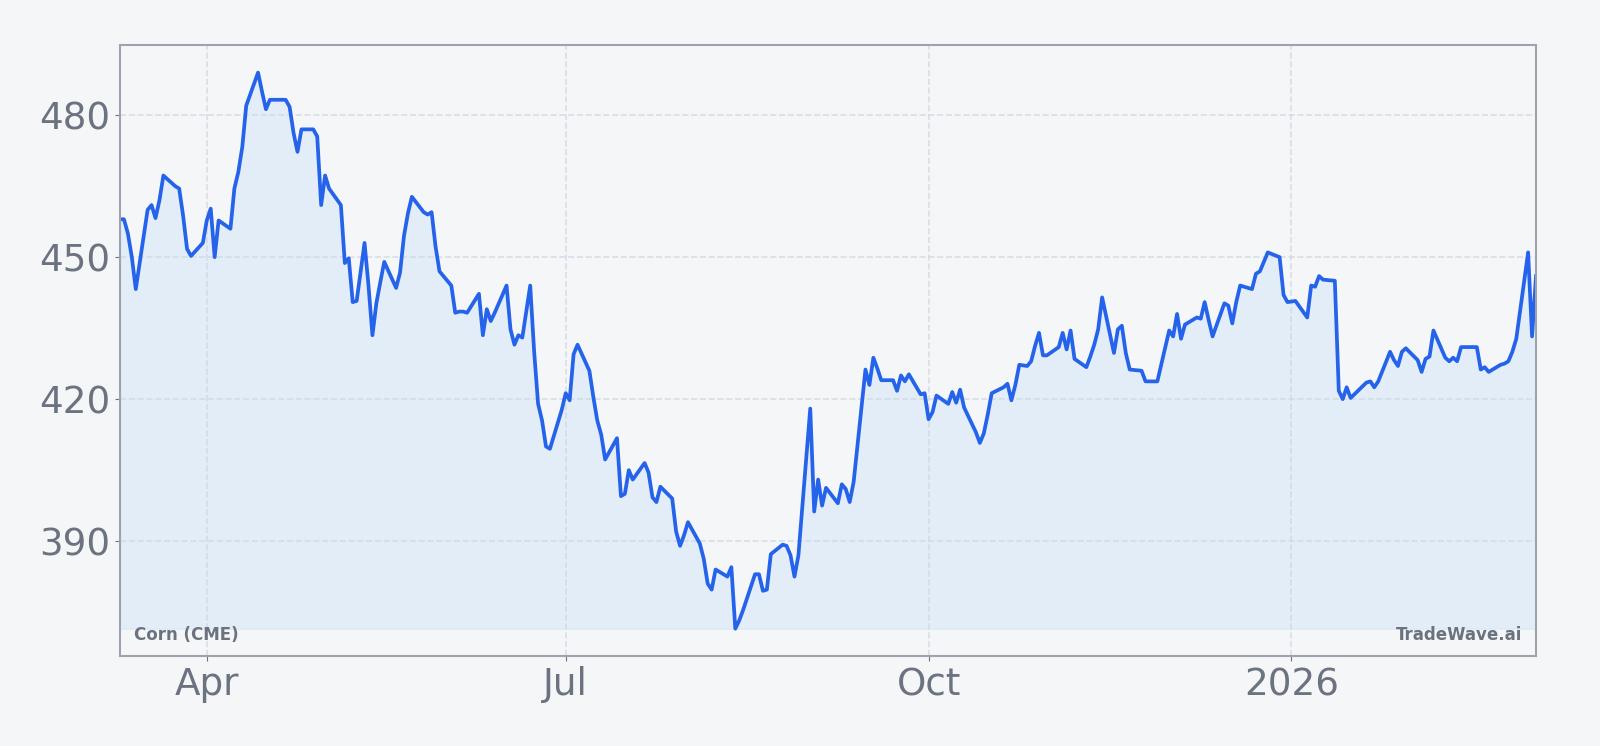
Corn (CME) futures settled at 452.5 on Mar 11, up 3.7% on the day and 3.56% over the past month, as the contract bounced from a still-depressed base relative to last year’s highs. The move leaves ZC trading below its 50-day simple moving average of 433.27 and on volume of 14,939 contracts against a 20-day average of 194,043, a reminder that the latest pop has come in thinner trade than the typical session.
The fundamental backdrop remains shaped by supply debates rather than fresh headlines. In Jan 2026, the USDA raised US ending stocks for corn, which earlier helped pressure grain futures as traders digested the prospect of more comfortable domestic supply.[1] In Mar 2025, clashing estimates over Brazil’s shrinking corn stocks highlighted how uncertain global balances can be when key exporters disagree on inventory levels, a theme that still hangs over the market as South American harvests roll forward.[2] In Jul 2025, expectations for record US corn exports without significant Chinese participation underscored how demand can shift across regions even when headline volumes look strong.[3]
Those cross-currents have kept speculative money cautious. In Jul 2025, market analysis pointed to speculators remaining bearish on grains, though less aggressively than the year before, as traders weighed higher US stocks against export strength and biofuel demand.[3] That lingering skepticism means the current rally is climbing a wall of worry, which can amplify moves if short covering collides with a historically supportive seasonal window.
The chart below situates the latest move in its recent multi-month context.
Macro and election-cycle context
The current seasonal window sits in the midterm election year of the US presidential cycle, a phase that often brings shifting expectations for farm policy, trade agreements and biofuel mandates. For corn, those policy levers can matter as much as weather, because they influence acreage decisions, export flows and domestic demand from ethanol producers.
In the last midterm cycle, Jul 2025 commentary around record US corn exports and a US biofuel boom highlighted how policy and demand can reinforce each other, tightening balances even when headline stocks look comfortable.[3] Earlier, in Mar 2025, questions over Brazil’s stock levels showed how quickly sentiment can swing when another major exporter appears to be running tighter than expected.[2] That mix of US policy and global supply uncertainty is the backdrop for the 2026 midterm-year window now underway.
Grouping the seasonal analysis by presidential election phase rather than by simple calendar years helps capture those recurring policy rhythms. Midterm years often feature debates over farm bills, trade enforcement and renewable fuel standards, all of which can shift expectations for future corn demand and acreage. The fact that Corn (CME) has historically traded with a bullish tilt in this specific midterm-year spring stretch suggests that, across very different macro regimes, this is a period when policy and planting expectations have often lined up in favor of higher prices.
What to watch in this window
For traders tracking this 62-day window, the first checkpoint is whether Corn (CME) can hold above the 50-day moving average and build on the early March bounce. Sustained trade above the mid-430s to mid-450s band would be consistent with the historical pattern of gradual gains through the middle of the window, while a quick slide back toward the 400 level would mark a clear deviation from prior midterm-year behavior.
On the macro side, upcoming USDA supply-and-demand updates and any revisions to US ending stocks will be critical. A surprise cut to US or Brazilian stock estimates would align with the historical tendency for this window to capture tightening-supply narratives, while another round of comfortable stock projections could test how much of the current move is seasonal versus fundamentally driven.[1][2]
Export data also bears watching. If the pattern from Jul 2025 repeats and US exports stay strong even without a major pickup from China, that could reinforce the idea that demand is broad enough to support higher prices into the heart of the window.[3] Conversely, a slowdown in shipments would make it harder for the seasonal tailwind to overcome softer fundamentals.
Finally, positioning will matter. Speculators were still net bearish on grains in mid-2025, though less aggressively than the year before, and any evidence that those shorts are being covered into strength would add fuel to a seasonal rally.[3] If, instead, fresh shorting appears into this bounce, it would signal that the market is willing to lean against the historical pattern and bet that higher US stocks and policy uncertainty will cap prices despite the midterm-year spring bias.
In short, the next two months offer a clean test of a little-known seasonal edge in Corn (CME): a historically strong midterm-year window colliding with a market still wrestling with supply, exports and skeptical speculative money.