Gold
COMEX Gold futures are the world's most liquid gold contract. Gold serves as a store of value, inflation hedge, and safe-haven asset during periods of geopolitical uncertainty.
A sharp divergence defines Gold's seasonal setup right now. The last 10 consecutive years show a 60% win rate over 30 days with a projected target of $4,470, implying a 10.3% gain. But midterm election years tell a different story: only 3 of 6 prior instances finished higher at 30 days, with a near-flat projected return of negative 0.01%.
That tension is the key variable to watch. Midterm years have historically pressured Gold at the 30 and 60-day marks, with the 60-day win rate dropping to just 33%. The 90-day window offers modest relief, where the broader 10-year trend shows a 70% win rate. Traders should treat near-term strength cautiously while monitoring whether the longer-horizon seasonal tailwind eventually reasserts itself.
Seasonal Price Projections
Select a historical basis and projection horizon to see where seasonal patterns suggest Gold may be headed.
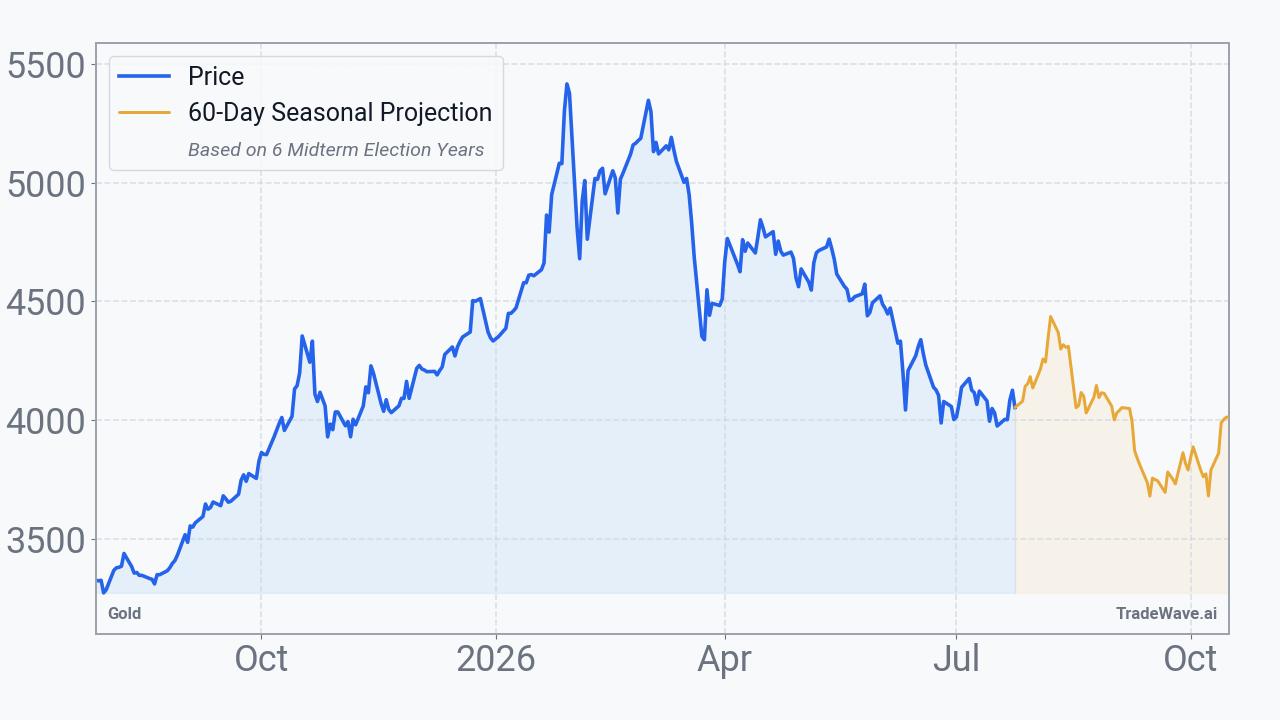
Projection as of Jul 27, 2026 from closing price $4,095.40
How to Use This Data
Seasonal projection data shows how Gold has historically performed during this exact calendar period across comparable years. The consecutive pattern reflects a 50.0% win rate, meaning Gold finished higher in exactly half of those historical instances. The midterm election year pattern shows a lower 33.3% win rate, indicating Gold rose in only one out of three comparable election-cycle years.
When consecutive and midterm election year bases point in opposite directions, as they do here, it signals that the political calendar may be influencing Gold's behavior differently than recent history alone would suggest. The median return is often more informative than the average in these cases, since a single extreme year can distort the average significantly. Here, the consecutive median of -0.2% tells a more cautious story than the +2.0% average.
Seasonal patterns cannot account for sudden geopolitical developments, central bank policy shifts, currency moves, or macroeconomic surprises that may emerge during any given period. A 50.0% win rate does not guarantee a positive outcome in any specific year. These projections reflect statistical tendencies drawn from history, not predictions of future performance.
Market participants often use seasonal data as one layer of context alongside technical analysis, macroeconomic fundamentals, and portfolio risk parameters. It can help frame expectations and timing awareness without serving as a standalone basis for any decision.
This information is provided for educational purposes only and does not constitute financial advice, a recommendation, or a solicitation to buy or sell any security. Seasonal patterns are based on historical data and do not guarantee future performance. All investment decisions carry risk. Consult a qualified financial advisor before making investment decisions.
Understanding Seasonal Projections
Seasonal projections estimate future price movement based on how Gold has historically performed during the same calendar period. These are statistical baselines derived from decades of market data, not predictions.
Consecutive Years (Last 10)
Uses the most recent 10 years of data regardless of market regime. This captures the broadest recent behavior, including all economic and political environments. Over the next 60 calendar days, this pattern has been positive 5 of 10 times with an average return of +2.0%.
Midterm Election Years (6 Available)
Uses only years that fall in the same position within the 4-year U.S. presidential election cycle. 2026 is a midterm election year. Markets often exhibit distinct patterns tied to fiscal and monetary policy shifts within this cycle. In 6 historical midterm election years, this 60-day window was positive 2 times with an average return of -0.3%.
Seasonal patterns reflect historical tendencies and do not guarantee future results. All projections are based on past performance and should be used as one input among many in your investment decision-making process. Data provided by TradeWave.ai.
Latest News
Recent headlines related to Gold, sourced from major financial news outlets with AI sentiment analysis.
- NovaGold Resources (TSX:NG) Faces A Valuation Test As M And A Call Sparks Fresh Interest
- Silver or Gold: Is a Mining Stock Fund Better Than Holding Physical Bullion Through an ETF?
- UFC star Sean Strickland's brutally blunt money advice hits 5.2M views — and it's just 2 simple steps
- Is Dorchester Minerals (DMLP) A Bargain On Its New Q2 2026 Cash Distribution?
- Canadian Natural Resources (TSX:CNQ) Could Be 8% Below Fair Value As Buy Rating Lifts Interest
- Stock Market Today, July 24: Dow Recovers and Sandisk Tumbles 11% as Tech Stocks Fall Further
- TSX Closer: Index Rises as Financials, Healthcare Gain; Oil Retreats Despite Geopolitical Risks
- Oil-Fueled Inflation Fears Pin Gold Near $4,000
- Repsol (BME:REP) Tripled First Half Net Income, Is The Stock Still Expensive?
- Peter Schiff sees something big in gold and silver
Explore More
Other markets with seasonal analysis and recent pattern articles.