Natural Gas
Henry Hub Natural Gas futures represent the benchmark price for natural gas in North America, heavily influenced by weather patterns and seasonal demand.
The 90-day seasonal window tells the most compelling story here: over the last 10 consecutive years, Natural Gas has finished higher 9 times from this point, projecting a 25.48% gain to $3.65. The 30-day and 60-day windows confirm the bullish lean with 80% win rates and double-digit projected returns. The critical tension, however, is the midterm election year overlay, which shows only 50% win rates at both the 30-day and 60-day horizons with negative average returns.
Natural Gas is notoriously volatile around winter demand cycles, and midterm years historically suppress that seasonal lift in the near term before recovering by the 90-day mark. The divergence between the broad 10-year trend and the political cycle pattern suggests patience matters here. Watch whether prices hold above $2.60 as the key near-term battleground.
Seasonal Price Projections
Select a historical basis and projection horizon to see where seasonal patterns suggest Natural Gas may be headed.
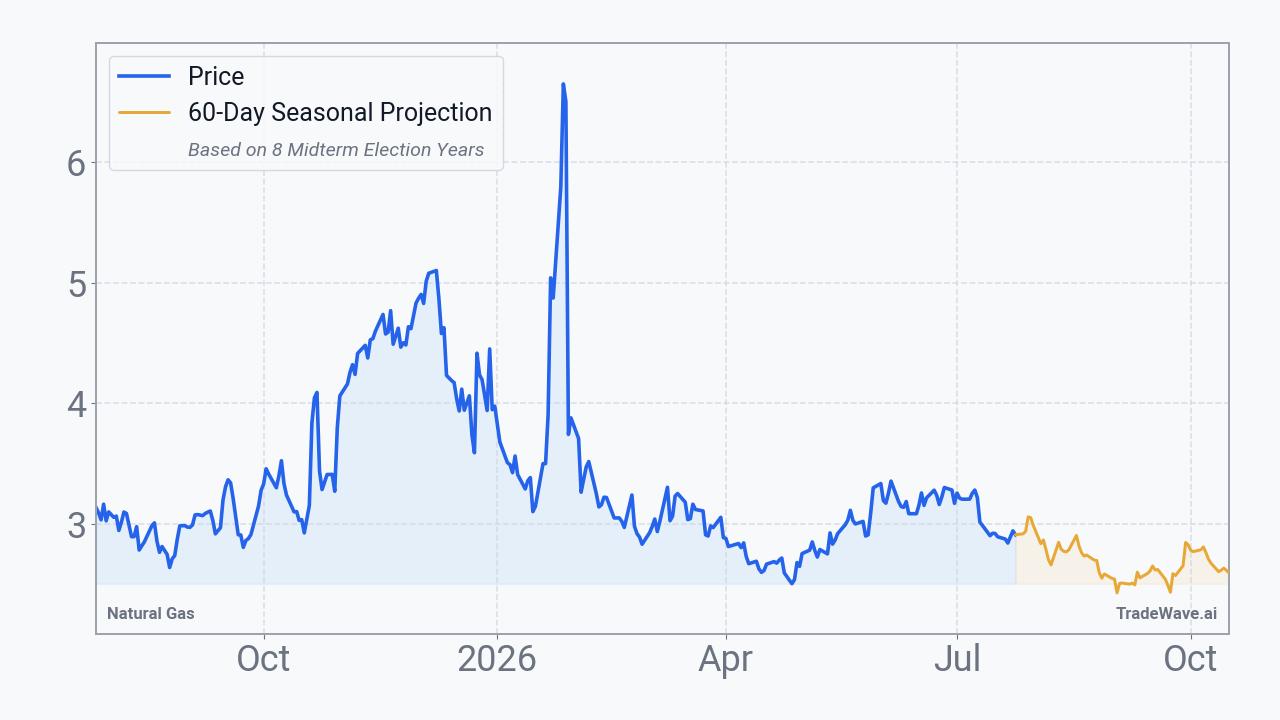
Projection as of Jul 27, 2026 from closing price $2.8230
How to Use This Data
Seasonal projection data reflects how Natural Gas has historically performed during this specific calendar window across past years. The consecutive pattern shows an 80.0% win rate, meaning prices finished higher in 8 out of every 10 comparable historical periods, with an average return of +16.8%. The midterm election year pattern tells a different story, with a 50.0% win rate and an average return of -4.5%.
When the two bases diverge as they do here, it signals that election cycle years have historically produced meaningfully different outcomes than the broader consecutive pattern. The median return is often more useful than the average because it reduces distortion from outlier years like the historical best of +57.2%, which can pull averages upward in ways that do not reflect typical behavior.
Seasonal patterns are built entirely from historical price behavior and cannot account for supply disruptions, weather events, policy shifts, geopolitical developments, or any other real-time market forces. An 80.0% win rate still implies a 20.0% historical loss rate, and no statistical tendency guarantees any specific outcome in a given year.
Market participants often use seasonal data as one layer of context alongside fundamental supply and demand analysis, technical price levels, and broader macroeconomic conditions. It can help frame historical tendencies and set expectations around timing, but it functions as background information rather than a standalone decision-making tool.
This information is provided for educational purposes only and does not constitute financial advice, a recommendation, or a solicitation to buy or sell any security. Seasonal patterns are based on historical data and do not guarantee future performance. All investment decisions carry risk. Consult a qualified financial advisor before making investment decisions.
Understanding Seasonal Projections
Seasonal projections estimate future price movement based on how Natural Gas has historically performed during the same calendar period. These are statistical baselines derived from decades of market data, not predictions.
Consecutive Years (Last 10)
Uses the most recent 10 years of data regardless of market regime. This captures the broadest recent behavior, including all economic and political environments. Over the next 60 calendar days, this pattern has been positive 8 of 10 times with an average return of +16.8%.
Midterm Election Years (8 Available)
Uses only years that fall in the same position within the 4-year U.S. presidential election cycle. 2026 is a midterm election year. Markets often exhibit distinct patterns tied to fiscal and monetary policy shifts within this cycle. In 8 historical midterm election years, this 60-day window was positive 4 times with an average return of -4.5%.
Seasonal patterns reflect historical tendencies and do not guarantee future results. All projections are based on past performance and should be used as one input among many in your investment decision-making process. Data provided by TradeWave.ai.
Latest News
Recent headlines related to Natural Gas, sourced from major financial news outlets with AI sentiment analysis.
- Argentina’s Oil Production Soars as Vaca Muerta Breaks New Records
- Intercontinental Exchange (ICE) Stock Looks Close To Fair Value Today
- EQT (EQT) Accelerates Southgate Pipeline Build While Adding Supply Deal And Midstream Assets
- Energy Transfer vs. Occidental Petroleum: The Better Energy Buy for the Second Half of 2026
- 360 Energy Pulse: What mattered this week in energy
- Sector Update: Energy Stocks Mixed Late Afternoon
- Costco Gas Demand Hits Record as Low Prices Drive Member Visits
- Sector Update: Energy Stocks Decline Pre-Bell Friday
- Enbridge Inc (ENB) is Attracting Investor Attention: Here is What You Should Know
- Record Q2 Results And Raised 2026 Guidance Might Change The Case For Investing In Kinder Morgan (KMI)
Explore More
Other markets with seasonal analysis and recent pattern articles.