Dow Jones Industrial Average
The Dow Jones Industrial Average tracks 30 prominent blue-chip companies listed on U.S. stock exchanges. It is one of the oldest and most-watched indices in the world.
The 90-day seasonal window is where the Dow's historical edge becomes undeniable. Over the last ten consecutive years, the index posts a 90% win rate across that horizon, projecting a move toward 65,991 and a 26.75% return from current levels. The 30-day picture is the outlier, with only 3 of 10 years finishing positive and an average return of negative 0.63%, signaling near-term turbulence before any sustained rally.
Midterm election years temper that optimism somewhat. The 90-day win rate drops to 66.7% in those cycles, with a more modest 18.50% projected return. The pattern suggests the Dow tends to stumble early in midterm years before recovering. Watch the 60-day window closely: both datasets converge near 70-80% win rates, making that the clearest confirmation zone for seasonal bulls.
Seasonal Price Projections
Select a historical basis and projection horizon to see where seasonal patterns suggest Dow Jones Industrial Average may be headed.
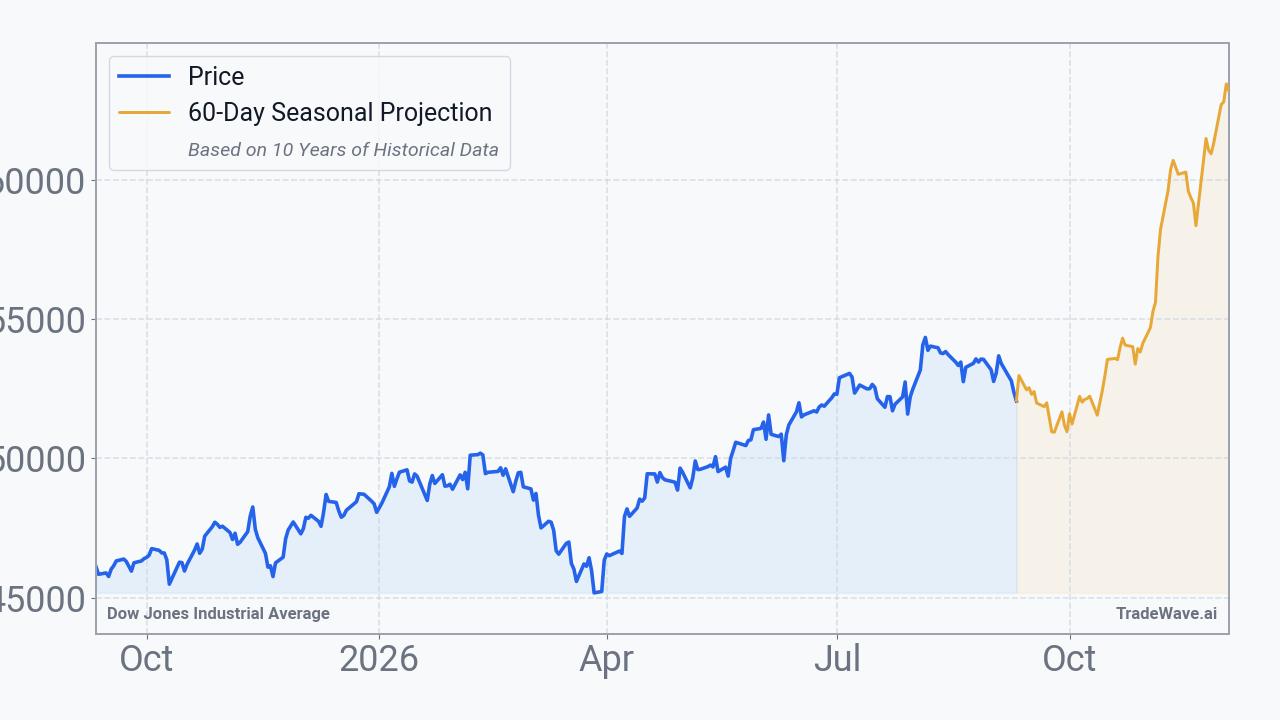
Projection as of Sep 11, 2026 from closing price $52,064.10
How to Use This Data
Seasonal projection data for the Dow Jones Industrial Average shows how the index has historically performed during this same calendar period across prior years. The 60-day consecutive win rate of 80.0% means the DJIA finished higher than its starting point in 80 out of every 100 comparable historical windows. The midterm election year win rate of 72.2% reflects performance specifically during years sharing that political calendar context.
When both the consecutive and midterm election year bases point in the same direction, the agreement adds weight to the pattern. Convergence across two independent bases suggests the tendency is not isolated to one narrow historical filter. The median return of roughly 3.1 to 3.4% is often more informative than the average because it is less distorted by unusually large outliers in either direction.
Seasonal patterns carry meaningful limitations. They cannot account for breaking news, Federal Reserve policy shifts, earnings surprises, or geopolitical developments that may occur during the period. A high win rate reflects historical frequency, not a guarantee of any specific outcome.
Market participants often use seasonal data as one layer of context alongside fundamental analysis and technical indicators. It can help frame historical tendencies and set expectations about the range of outcomes, but it does not replace comprehensive analysis or account for individual risk tolerance.
This information is provided for educational purposes only and does not constitute financial advice, a recommendation, or a solicitation to buy or sell any security. Seasonal patterns are based on historical data and do not guarantee future performance. All investment decisions carry risk. Consult a qualified financial advisor before making investment decisions.
Understanding Seasonal Projections
Seasonal projections estimate future price movement based on how Dow Jones Industrial Average has historically performed during the same calendar period. These are statistical baselines derived from decades of market data, not predictions.
Consecutive Years (Last 10)
Uses the most recent 10 years of data regardless of market regime. This captures the broadest recent behavior, including all economic and political environments. Over the next 60 calendar days, this pattern has been positive 8 of 10 times with an average return of +3.3%.
Midterm Election Years (18 Available)
Uses only years that fall in the same position within the 4-year U.S. presidential election cycle. 2026 is a midterm election year. Markets often exhibit distinct patterns tied to fiscal and monetary policy shifts within this cycle. In 18 historical midterm election years, this 60-day window was positive 13 times with an average return of +3.3%.
Seasonal patterns reflect historical tendencies and do not guarantee future results. All projections are based on past performance and should be used as one input among many in your investment decision-making process. Data provided by TradeWave.ai.
Explore More
Other markets with seasonal analysis and recent pattern articles.