CBOE Volatility Index
The VIX measures the market's expectation of 30-day forward-looking volatility, derived from S&P 500 index options. Often called the 'fear gauge,' it rises during periods of market uncertainty.
Seasonal history sends a clear anxiety signal for the VIX over the next two months. In the last ten years, the VIX rose in 7 of 10 sixty-day periods from this point, with an average increase of 9.76%, projecting a level near 22.44. Midterm election years amplify that pattern, with the VIX rising in 5 of 8 comparable periods and a median gain of 20.60%, pointing toward 22.54. Both lenses converge on elevated uncertainty ahead, which historically correlates with equity market stress.
The 90-day window is where midterm years diverge most sharply from the norm. The average VIX increase reaches 20.49% in midterm cycles, with a median of 25.09%. Investors should watch whether equity markets begin pricing in election-cycle uncertainty as spring progresses, as rising VIX readings at these levels have historically preceded meaningful stock market turbulence.
Seasonal Price Projections
Select a historical basis and projection horizon to see where seasonal patterns suggest CBOE Volatility Index may be headed.
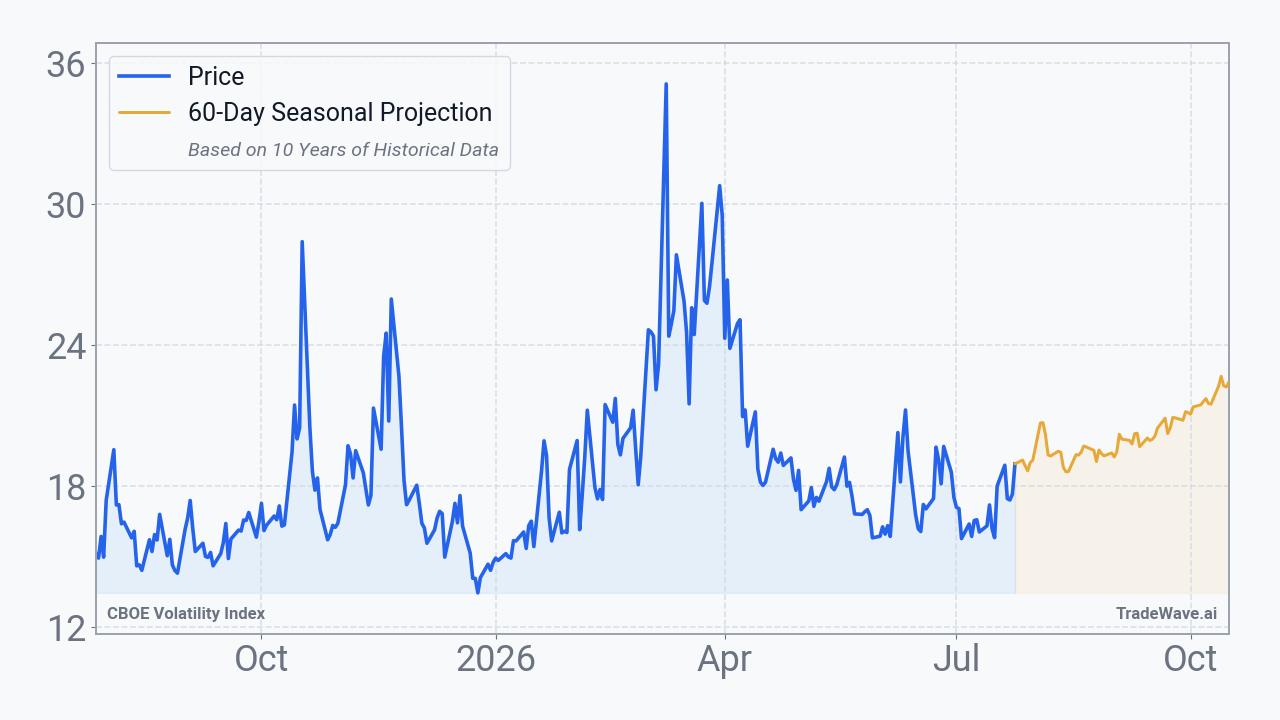
Projection as of Jul 27, 2026 from closing price $18.58
How to Use This Data
Seasonal projection data for the CBOE Volatility Index reflects how VIX has historically behaved during this same calendar window across comparable years. In consecutive periods, VIX increased 70.0% of the time, and in midterm election years specifically, it increased 62.5% of the time. Both rates signal a historical tendency toward elevated market anxiety during this stretch.
When two independent bases, consecutive years and midterm election years, point in the same direction, the convergence adds weight to the pattern. The median return of +9.0% for consecutive periods is often more informative than the average of +9.8%, since medians are less distorted by extreme outliers like the historical best of +38.8% or worst of -7.2%.
Seasonal patterns cannot account for breaking news, policy shifts, earnings surprises, or geopolitical developments that may arise. A high historical rate of VIX increases does not guarantee volatility will spike in any given year. These projections represent statistical tendencies drawn from past data, not forward-looking forecasts.
Market participants can use seasonal VIX data as one diagnostic lens among many when assessing the broader equity environment. Higher projected VIX readings historically correlate with periods of market turbulence, while lower readings suggest relative stability. This context is most useful when weighed alongside fundamental analysis, technical indicators, and individual risk considerations.
This information is provided for educational purposes only and does not constitute financial advice, a recommendation, or a solicitation to buy or sell any security. Seasonal patterns are based on historical data and do not guarantee future performance. All investment decisions carry risk. Consult a qualified financial advisor before making investment decisions.
Understanding Seasonal Projections
Seasonal projections estimate future price movement based on how CBOE Volatility Index has historically performed during the same calendar period. These are statistical baselines derived from decades of market data, not predictions.
Consecutive Years (Last 10)
Uses the most recent 10 years of data regardless of market regime. This captures the broadest recent behavior, including all economic and political environments. Over the next 60 calendar days, this pattern has been positive 7 of 10 times with an average return of +9.8%.
Midterm Election Years (8 Available)
Uses only years that fall in the same position within the 4-year U.S. presidential election cycle. 2026 is a midterm election year. Markets often exhibit distinct patterns tied to fiscal and monetary policy shifts within this cycle. In 8 historical midterm election years, this 60-day window was positive 5 times with an average return of +15.9%.
Seasonal patterns reflect historical tendencies and do not guarantee future results. All projections are based on past performance and should be used as one input among many in your investment decision-making process. Data provided by TradeWave.ai.
Latest News
Recent headlines related to CBOE Volatility Index, sourced from major financial news outlets with AI sentiment analysis.
- SK Hynix and Micron Sink 6%, SanDisk Drops 9% as Korea Chip Selloff Hits U.S. Memory Stocks
- Should Investors Turn to Inverse ETFs as Market Risks Build?
- A violent AI unwind is hiding beneath a resilient stock market: Chart of the Day
- Seeking Stability? Investing in These ETFs Could Make Sense Now
- Fear Index Jumps as Tech Rout Worsens
- Market's Fear Index Signals Calm as Investors Pile Back Into Tech
- Macro-Volatility Subsides, Micro-Volatility Ticks Higher
- Wall Street's Fear Index Rises on a Critical Day for Markets
- Update: US Equity Indexes Slump, Crude Oil Soars as Trump Plans to Reinstate Iran Blockade, Impose 20% Toll on Hormuz Cargo
- Update: US Equity Indexes Rise as Diplomatic Engagements Between Washington, Iran Send Crude Oil Lower
Explore More
Other markets with seasonal analysis and recent pattern articles.