Crude Oil (WTI)
West Texas Intermediate (WTI) crude oil is the primary benchmark for U.S. oil pricing. It is one of the most actively traded commodities in the world.
Seasonal history offers little encouragement for WTI crude at current levels. The 90-day window carries the most weight here: the last 10 consecutive years show only a 40% win rate with a projected decline to $85.32, while midterm election years project an even steeper drop to $77.91, implying a 15.82% loss. Both timeframes align bearishly, creating a rare and notable confluence of negative signals.
What makes crude distinctive is its extreme dispersion. Midterm years show a best case of plus 70.91% alongside a worst case of minus 20.33%, meaning the average masks wild swings. With WTI already down 5% recently, traders should watch whether the $80 level holds, as a break there would validate the bearish seasonal setup heading into the back half of the year.
Seasonal Price Projections
Select a historical basis and projection horizon to see where seasonal patterns suggest Crude Oil (WTI) may be headed.
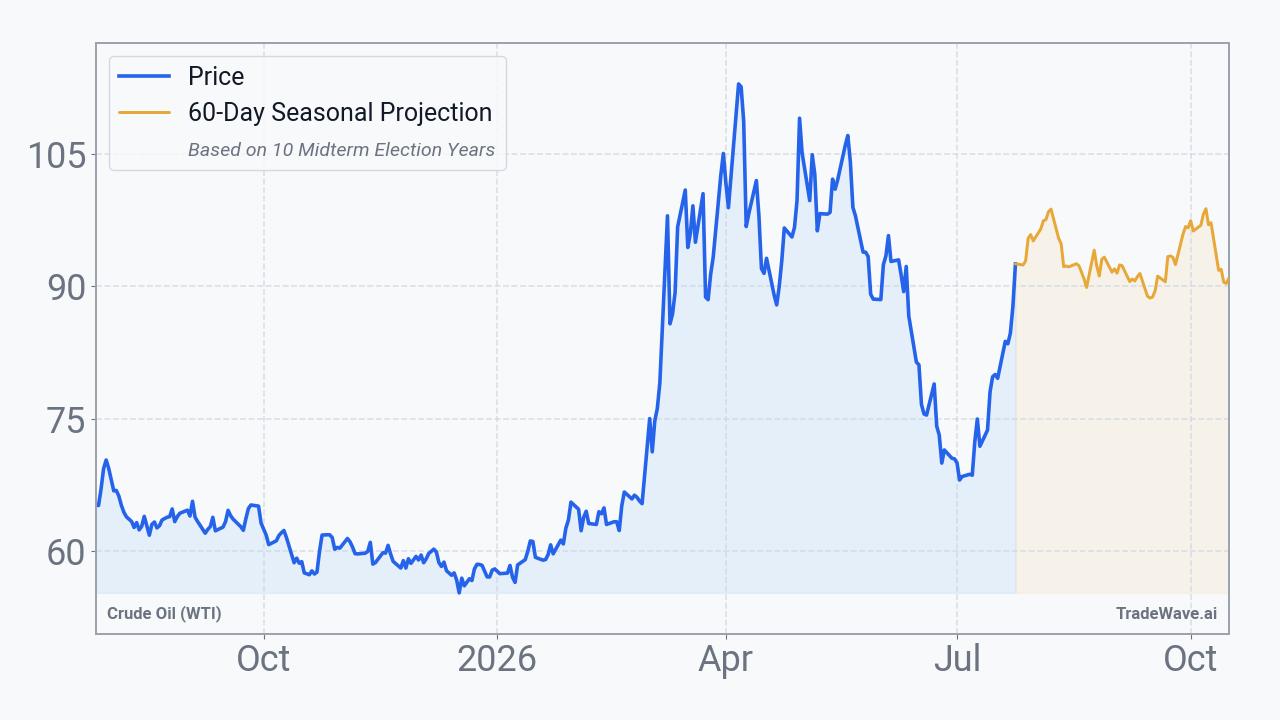
Projection as of Jul 27, 2026 from closing price $84.81
How to Use This Data
Seasonal projection data for Crude Oil (WTI) reflects how the commodity has historically performed during this specific calendar window. The consecutive pattern shows a 50.0% win rate, meaning WTI finished higher than its starting price in exactly half of the comparable historical periods. The midterm election year pattern carries the same 50.0% win rate but a notably higher average return of 9.2%.
When two bases diverge, as they do here, the patterns are pointing in opposite directions, with the consecutive basis projecting a 5.0% gain and the election year basis projecting a 1.8% decline. The median return is often more useful than the average because it is less distorted by outlier years like the worst recorded loss of 20.1%, which can skew averages significantly.
Seasonal patterns are built entirely from historical price behavior and cannot incorporate current geopolitical developments, supply disruptions, policy shifts, or macroeconomic surprises. A 50.0% win rate reflects a coin-flip historical tendency, not a reliable prediction for any single year. The projection is a statistical summary, not a forecast.
Market participants often use seasonal data as one layer of context alongside technical analysis, fundamental supply-and-demand research, and broader risk frameworks. It can help calibrate expectations about historical tendencies during a given period without dictating any particular course of action.
This information is provided for educational purposes only and does not constitute financial advice, a recommendation, or a solicitation to buy or sell any security. Seasonal patterns are based on historical data and do not guarantee future performance. All investment decisions carry risk. Consult a qualified financial advisor before making investment decisions.
Understanding Seasonal Projections
Seasonal projections estimate future price movement based on how Crude Oil (WTI) has historically performed during the same calendar period. These are statistical baselines derived from decades of market data, not predictions.
Consecutive Years (Last 10)
Uses the most recent 10 years of data regardless of market regime. This captures the broadest recent behavior, including all economic and political environments. Over the next 60 calendar days, this pattern has been positive 5 of 10 times with an average return of +0.6%.
Midterm Election Years (10 Available)
Uses only years that fall in the same position within the 4-year U.S. presidential election cycle. 2026 is a midterm election year. Markets often exhibit distinct patterns tied to fiscal and monetary policy shifts within this cycle. In 10 historical midterm election years, this 60-day window was positive 5 times with an average return of +9.2%.
Seasonal patterns reflect historical tendencies and do not guarantee future results. All projections are based on past performance and should be used as one input among many in your investment decision-making process. Data provided by TradeWave.ai.
Latest News
Recent headlines related to Crude Oil (WTI), sourced from major financial news outlets with AI sentiment analysis.
- Dow Jones Futures Rise, Oil Prices Dive Amid Iran News; Apple Leads Earnings Wave, Fed Meeting Ahead
- Dow Jones Futures Due, Iran News In focus; Apple Leads Earnings Wave, Fed Meeting Ahead
- U.S. Jet Fuel Costs Soar as Iran War Hits Airlines Again
- Argentina’s Oil Production Soars as Vaca Muerta Breaks New Records
- FOMC Preview: Fed likely to hold rates despite oil spike, Citi sees dovish outcome
- Barclays Says Big Tech Earnings and Central Banks Will Drive Summer Markets
- Stock Market Week Ahead: Mag 7 And The Fed — But It's All About The Cash
- Wall Street Sees Diplomacy or Escalation as Trump’s Two Middle East Options
- Bitcoin price holds above $64,000 as traders brace for upcoming Fed decision
- Data Centers — Not Iran — Are Fueling the U.S.’s Coming Energy Crisis
Explore More
Other markets with seasonal analysis and recent pattern articles.