NASDAQ Composite
The NASDAQ Composite index includes over 3,000 stocks listed on the Nasdaq exchange, heavily weighted toward technology and growth companies.
The near-term seasonal setup for the NASDAQ shows a sharp split depending on which lens you apply. The last 10 years favor a 30-day gain of 4.42% with a 70% win rate, projecting a target near 26,217. But midterm election years tell a different story, with a negative 1.29% average return over the same window and a 90-day win rate of just 38.5%.
That divergence is the key tension here. The NASDAQ's growth-stock concentration amplifies election-cycle volatility, and midterm years historically pressure the index harder than broader markets. The 60-day midterm projection of negative 6.29% deserves particular attention. Watch whether the index holds current levels through the next 30 days as the critical early signal.
Seasonal Price Projections
Select a historical basis and projection horizon to see where seasonal patterns suggest NASDAQ Composite may be headed.
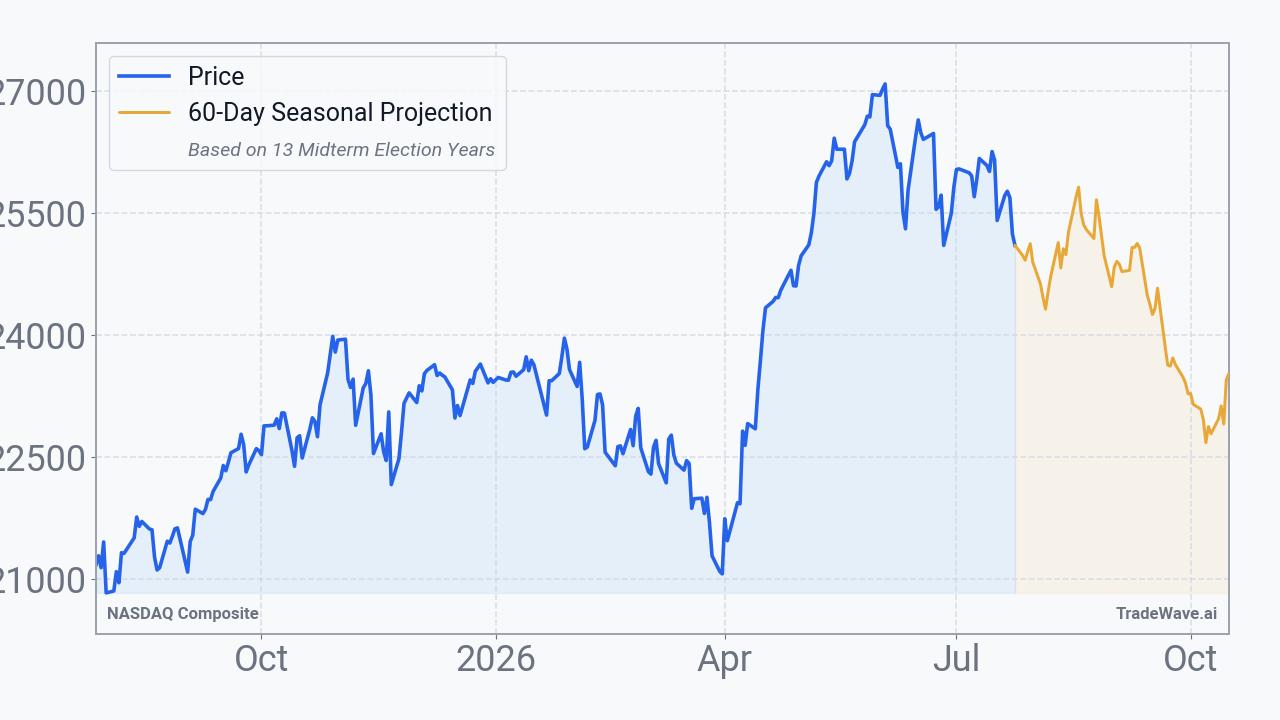
Projection as of Jul 27, 2026 from closing price $24,975.82
How to Use This Data
Seasonal projection data for the NASDAQ Composite reflects how the index has historically performed during this same calendar period across prior years. The 60.0% consecutive win rate means the index closed higher 60.0% of the time in comparable historical windows, while the midterm election year win rate of 53.8% represents a narrower historical edge specific to that political cycle.
When the two bases diverge, as they do here, it signals that the election cycle context has historically produced meaningfully different outcomes than the broader consecutive pattern. The consecutive base projects a return of +4.4% while the PE base projects -6.3%, a notable split. Median returns are often more informative than averages because a single extreme year can distort the average significantly, making the median a cleaner representation of typical outcomes.
Seasonal patterns are built entirely from historical data and cannot incorporate current events, policy shifts, earnings surprises, or geopolitical developments. A 60.0% win rate still implies a 40.0% historical loss rate, and no win rate guarantees any specific outcome in a given year. These projections describe statistical tendencies, not predictions.
Market participants often use seasonal data as one layer of context alongside fundamental analysis, technical signals, and macroeconomic conditions. It can help frame expectations about historical tendencies during a given period, but it functions as background context rather than a standalone decision-making tool.
This information is provided for educational purposes only and does not constitute financial advice, a recommendation, or a solicitation to buy or sell any security. Seasonal patterns are based on historical data and do not guarantee future performance. All investment decisions carry risk. Consult a qualified financial advisor before making investment decisions.
Understanding Seasonal Projections
Seasonal projections estimate future price movement based on how NASDAQ Composite has historically performed during the same calendar period. These are statistical baselines derived from decades of market data, not predictions.
Consecutive Years (Last 10)
Uses the most recent 10 years of data regardless of market regime. This captures the broadest recent behavior, including all economic and political environments. Over the next 60 calendar days, this pattern has been positive 6 of 10 times with an average return of +0.3%.
Midterm Election Years (13 Available)
Uses only years that fall in the same position within the 4-year U.S. presidential election cycle. 2026 is a midterm election year. Markets often exhibit distinct patterns tied to fiscal and monetary policy shifts within this cycle. In 13 historical midterm election years, this 60-day window was positive 7 times with an average return of -2.5%.
Seasonal patterns reflect historical tendencies and do not guarantee future results. All projections are based on past performance and should be used as one input among many in your investment decision-making process. Data provided by TradeWave.ai.
Latest News
Recent headlines related to NASDAQ Composite, sourced from major financial news outlets with AI sentiment analysis.
- Kospi index and U.S. stock futures jump as new Hormuz talks send oil prices plunging amid Iran war pause while Wall Street awaits Fed meeting
- Dow Jones Futures Rise, Oil Prices Dive Amid Iran News; Apple Leads Earnings Wave, Fed Meeting Ahead
- Dow Jones Futures Due, Iran News In focus; Apple Leads Earnings Wave, Fed Meeting Ahead
- Dow Jones Futures: U.S., Iran Halt Attacks; Apple Leads Earnings Wave, Fed Meeting Ahead
- 4 Big Tech earnings reports, a Fed meeting, and $100 oil: It's the busiest week of the quarter
- Top 3 US Stock Market Stories From This Week
- Cathie Wood Just Poured $18 Million Into Meta Stock. Here’s Why.
- Citi Warns U.S. Equity Positioning May Face Further Pressure
- The Clock Is Ticking on Wall Street's $1.5 Trillion Powder Keg, and History Says Time Is Almost Up
- Dow Jones Futures: Market Triggers Sell Signal; Apple Earnings, Iran News, Fed Meeting In Focus
Explore More
Other markets with seasonal analysis and recent pattern articles.