S&P 500 Energy Sector SPDR (XLE) Has Rallied in 6 of 6 Midterm Spring Windows
S&P 500 Energy Sector SPDR is stepping into a historically strong 61-day midterm-year stretch just as geopolitical shocks and options positioning refocus attention on energy risk and upside.

Key takeaways
- XLE’s 61-day window starting Mar 3 in midterm election years has been positive in all 6 historical cycles, with an average gain of 6.97% for long exposure.
- The pattern is long-biased, with 6 winners and 0 losers and a Sharpe ratio of 2.23, pointing to unusually consistent risk‑adjusted returns for this slice of the calendar.
- Average winner gains of 6.97% sit alongside a TradeWave Ratio of 5.01, indicating that price has typically traveled meaningfully in the trade direction within the window.
- Intraperiod swings have been real: maximum favorable moves have reached double digits in several years, while the worst drawdowns have run as deep as about 6% before recovering.
- The window captures the early part of midterm election years, when policy uncertainty and geopolitical shocks often collide with energy supply narratives.
- History is supportive but not risk‑free; traders should treat this as a strong seasonal tailwind, not a guarantee, and respect the drawdown profile inside the window.
According to historical data from TradeWave.ai, this specific midterm-year stretch in XLE has behaved very differently from an average two-month period, and the next iteration begins today.
Seasonal window
S&P 500 Energy Sector SPDR has risen in 6 of 6 midterm election years during this 61-day window starting Mar 3, averaging 6.97% gains for long positions. The ETF is coming off a strong month, with a 1‑month return of 11.73% and trading near the upper end of its 52‑week range between 17.71 and 57.88. That combination of a clean seasonal record and a fresh price surge gives this year’s window more weight than usual for traders trying to handicap how energy leadership might evolve into spring.
Grouping the data by the presidential election cycle matters here because midterm years often feature a different policy and liquidity backdrop than election or pre‑election years. Fiscal debates, regulatory noise and geopolitical flare‑ups tend to cluster in this phase, and energy has historically been one of the sectors most sensitive to those cross‑currents.
This seasonal window begins on Mar 3 and spans 61 trading days. Historically, during this period in the last six midterm election years, S&P 500 Energy Sector SPDR has shown a strong upside tendency for long exposure, with no losing years in the sample. The trade direction for this pattern is explicitly long, so the historical gains line up with the intended bias rather than coming from short squeezes or one‑off spikes.
Across those six midterm-year windows, the Percent Profitable figure is 100%, with 6 winners and 0 losers. Average profit for the winning years is 6.97%, and because there were no losing years, the all‑years average is effectively the same. That is a rare profile for a sector ETF over a two‑month span, especially in a part of the cycle that is often choppy for the broader market.
The per‑year breakdown shows how that consistency has played out. The weakest outcome in the sample came in 2002, when XLE still managed a 2.63% gain from entry to exit. The strongest close‑to‑close result was 10.01% in 2006, with other midterm years like 2014 and 2018 posting gains of 8.14% and 9.64% respectively. Even 2022, a volatile year for risk assets, delivered a 5.42% net return inside this same calendar slice.
Intraperiod swings have been meaningful, which is where the maximum favorable and adverse moves come into focus. In 2022, for example, the best point‑to‑peak move within the window reached 12.54%, while the worst drawdown from entry was 3.67%. In 2006, the maximum favorable move was 10.9% against a maximum adverse move of 6.61%. That mix of double‑digit upside potential and mid‑single‑digit downside excursions is typical of the window’s risk‑reward profile.
The TradeWave Ratio for this pattern is 5.01. TradeWave Ratio (TWR) reflects how far price typically travels in the trade direction within the window regardless of the final close. A value above 5 for a sector ETF over 61 days suggests that when this window moves, it tends to move with conviction rather than grinding sideways.
On a risk‑adjusted basis, the Sharpe ratio of 2.23 stands out. Sharpe ratio is a risk‑adjusted average return based on end‑of‑window outcomes, and values above 2 are uncommon for short seasonal windows. Combined with a standard deviation of 2.83%, the pattern points to relatively tight clustering of outcomes around that mid‑single‑digit gain.
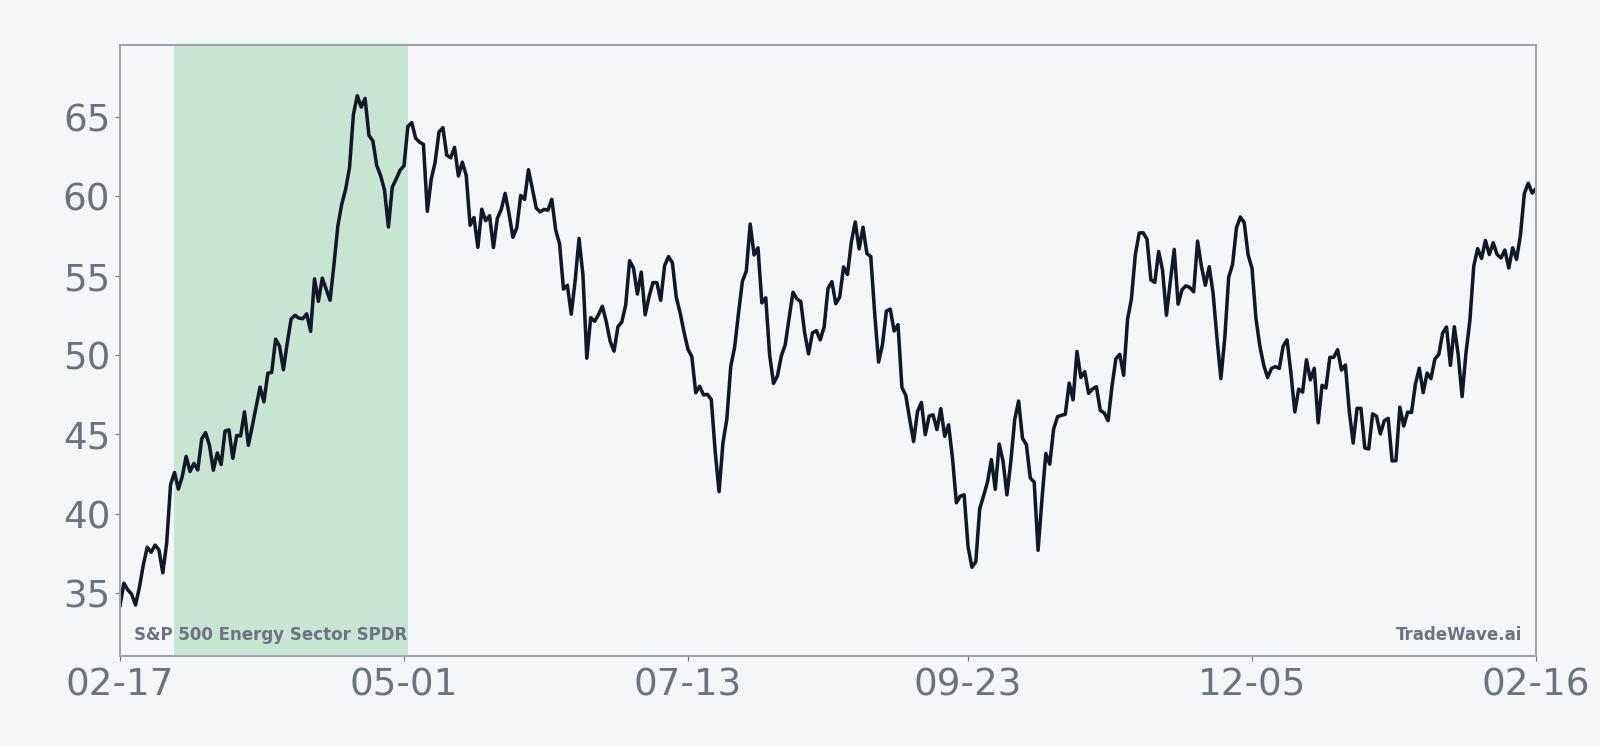
The historical seasonal trend chart for this window shows a fairly steady upward slope rather than a single burst. Gains tend to build across the full 61 days, with only modest pauses, which is consistent with the idea that energy strength in midterm springs often reflects a series of catalysts rather than one headline shock.
Year‑by‑year bars with maximum favorable and adverse moves show how upside and drawdowns have coexisted inside this window.
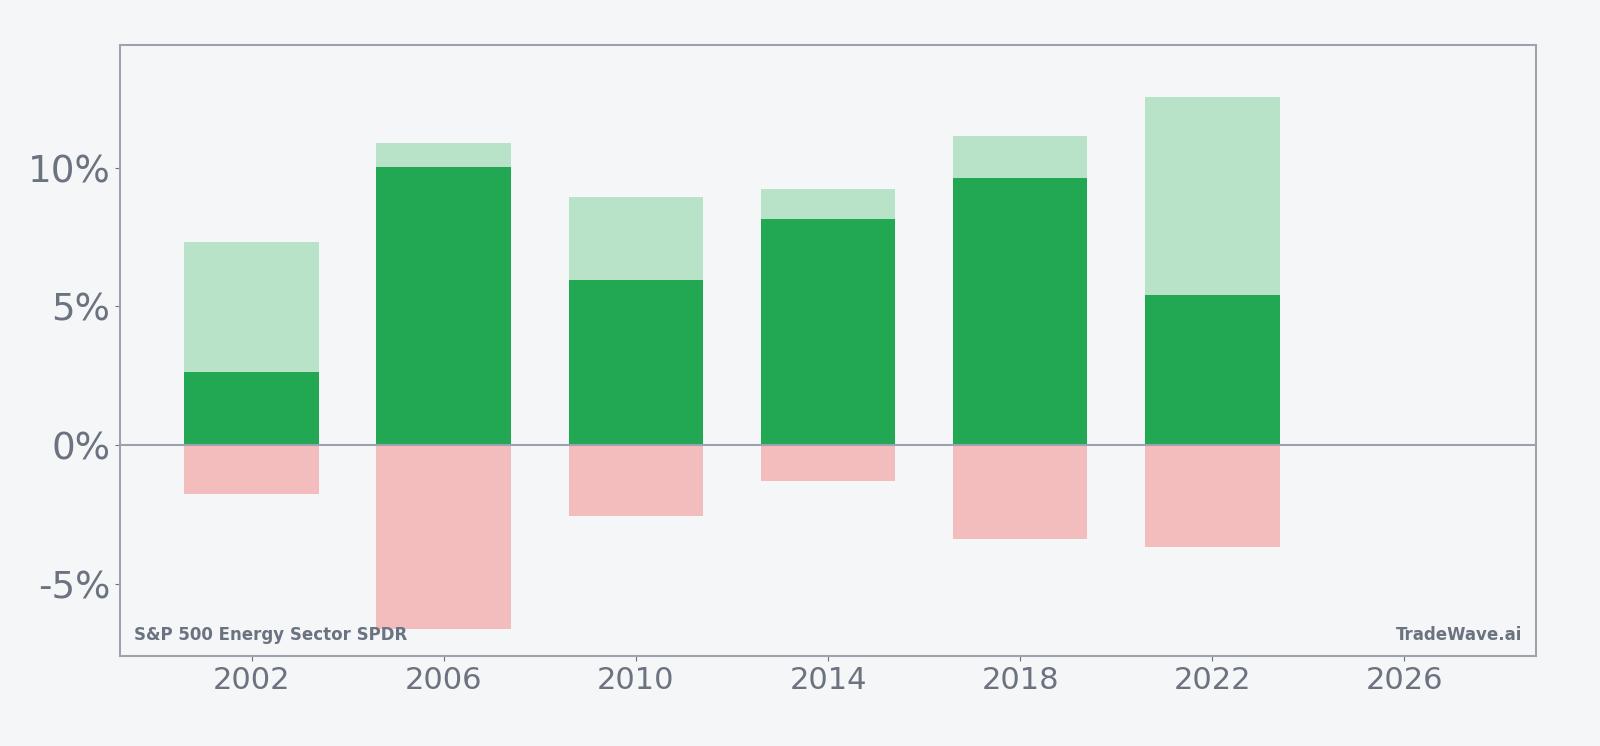
History does not guarantee future results, and even in a 6‑for‑6 window, adverse excursions within the period can be sizable before any recovery.
Price and near-term drivers
XLE’s latest surge has been driven less by earnings and more by geopolitics. On Mar 2, U.S.-Israeli strikes on Iran rattled energy markets, pushed crude higher and helped drive XLE to a fresh 52‑week high as retail investors piled into the ETF, buying more than $14 million in the first hour of trading and leaning on strategies that sell puts and buy calls to capture sector upside.[1]
The chart below situates the latest move in its recent multi‑month context.
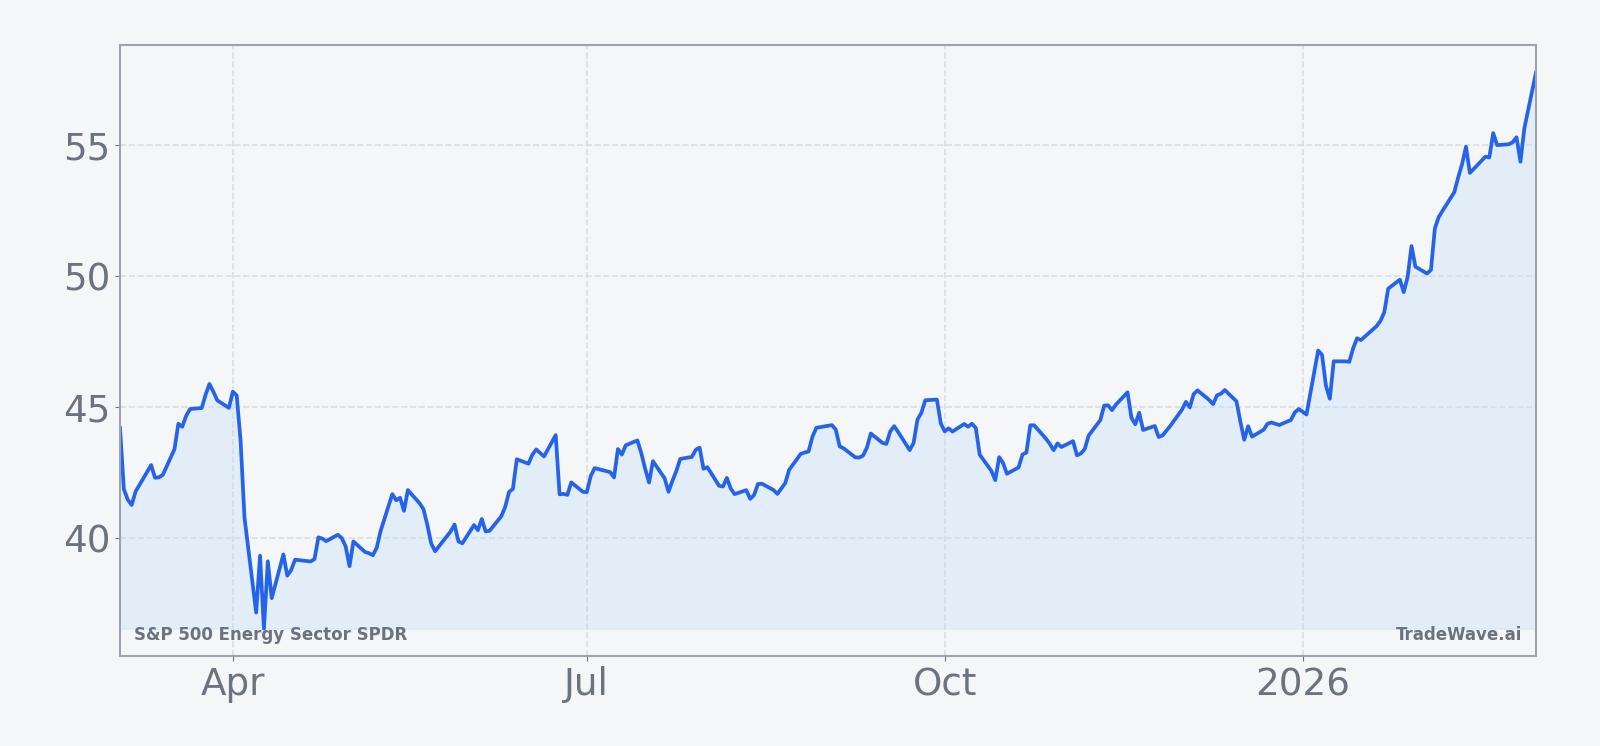
The geopolitical backdrop remains fragile. The strikes on Iran raise the risk of a more prolonged conflict that could disrupt oil supplies and keep energy prices elevated, a setup that tends to benefit integrated producers and refiners inside XLE but can weigh on broader risk sentiment if it feeds inflation worries.[1] Sector strategists have framed the current moment as an inflection point for energy, with options traders increasingly using XLE as the liquid vehicle for expressing bullish views on the space.[2]
That positioning matters as the seasonal window opens. When an ETF is already near its 52‑week high and options flows are skewed toward upside structures, a historically strong window can either reinforce the trend or set the stage for sharper shakeouts if macro headlines shift. The historical pattern does not speak to timing individual headlines, but it does suggest that this is a part of the calendar when energy moves tend to be larger and more persistent than usual in midterm years.
What to watch in this window
For the next 61 trading days, the key question is whether XLE behaves like the prior six midterm-year windows or breaks the pattern. The historical record favors continued strength for long exposure, but the path has rarely been smooth, with several years showing early drawdowns before finishing higher.
First, watch how XLE trades around any further headlines out of the Middle East. If crude spikes are met with sustained buying in the ETF rather than quick fades, that would rhyme with prior midterm springs where energy leadership persisted across the window.[1] A sharp reversal on seemingly bullish oil news would be an early sign that this cycle may diverge from the script.
Second, monitor options and retail flow. The recent pattern of selling puts and buying calls to lean into upside, alongside heavy early‑session retail buying, is a clear Special Insight into how investors are positioned.[1][2] If that flow continues to build as the window progresses, it could amplify the historical upside tendency; if it dries up or flips toward protective structures, it would suggest traders are fading the seasonal edge.
Third, keep an eye on how XLE trades relative to its recent 52‑week high zone. In prior midterm years, the strongest windows often saw the ETF break out and hold above prior resistance rather than chopping sideways. A pattern of higher highs and higher lows through the bulk of the 61 days would be consistent with the historical trend, while repeated failures at the highs would argue for a more cautious read.
Finally, remember that this window sits in the early part of the midterm election year, a phase that has often been volatile for the broader market even when energy has done well. If XLE can maintain leadership while indices wobble around policy debates and rate expectations, it would reinforce the idea that this sector’s midterm spring pattern is structurally different from the rest of the tape.