CBOE Volatility Index (VIX) Has Fallen in 10 of 11 Years in This 126-Day Volatility Window
CBOE Volatility Index is sliding from elevated levels just as a historically bearish 126-day stretch for volatility begins, raising questions about how long equity markets can lean on this seasonal tailwind.

Key takeaways
- A 126-day seasonal window for the CBOE Volatility Index that began on Mar 8 has historically favored short volatility positions, with VIX falling in 10 of the past 11 years.
- The pattern is short-directed, with a 91% Percent Profitable record across the last decade and an Avg Profit of 22.86% in winning years versus an Avg Profit - All of 23% when every year is included.
- Across the sample, the window has produced an 806% Cumulative Return for the short-volatility strategy and a Sharpe ratio of 1.62, signaling unusually strong risk-adjusted performance.
- Intraperiod swings have been large: maximum favorable moves have exceeded 50% in several years, while adverse excursions have at times pushed beyond 40% against the trade before reversing.
- VIX closed at 25.5 on Mar 9, about 57.6% below its 52-week high of 60.13 yet still well above its 52-week low of 13.38, leaving room for both further compression and sharp spikes.
- History shows this window often starts choppy but tends to reward patience for short-volatility positions as spikes fade and implied volatility grinds lower into the back half of the period.
According to historical data from TradeWave.ai, this specific 126-day stretch has behaved very differently from an average VIX month, with a clear directional bias that most volatility traders do not have on their radar.
Seasonal window
CBOE Volatility Index has moved lower in 10 of the past 11 years during this 126-day window, with a short-volatility strategy averaging 22.86% gains in winning years. The latest iteration began on Mar 8 with VIX at 25.5, leaving it about 57.6% below its 52-week high of 60.13 but still well above the 52-week low of 13.38. That mix of elevated starting levels and a historically bearish window for volatility gives equity traders a rare, calendar-based backdrop to frame how long this latest volatility retreat might run.
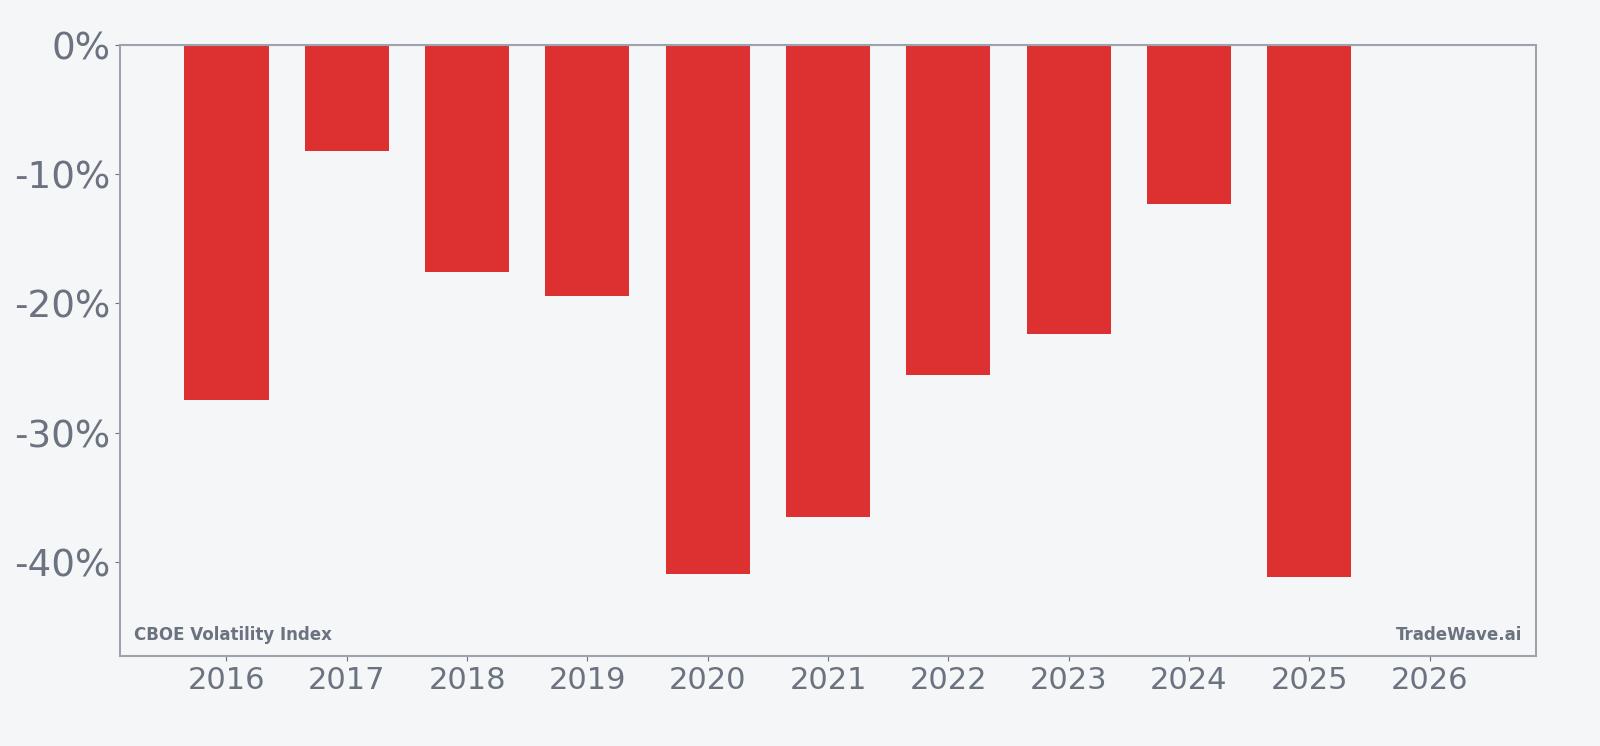
Historically, this window has been a clear short-volatility regime. Percent Profitable sits at 91%, with 10 winning years against just 1 loser across the last decade. Because the Trade Direction is short, negative net returns in the VIX are favorable outcomes, and the pattern has delivered an 806% Cumulative Return with a 22.2% Annualized Return for that short exposure.
The Avg Profit of 22.86% captures only the winning years, while the Avg Profit - All of 23% folds in the lone losing year and still leaves the overall profile slightly stronger. That combination, alongside a Sharpe ratio of 1.62, points to a window where downside in implied volatility has not just been frequent but also relatively well-compensated for the risk taken.
The per-year breakdown shows how this plays out in practice. In 2020, a short VIX position in this window would have gained 40.89% as the index fell from 54.46 to 32.19 after the initial pandemic shock, even though intraperiod swings were violent. In contrast, 2017 was one of the softer years, with a 8.18% gain for the short strategy as VIX drifted from 11.86 to 10.89, still aligning with the broader pattern of volatility compression.
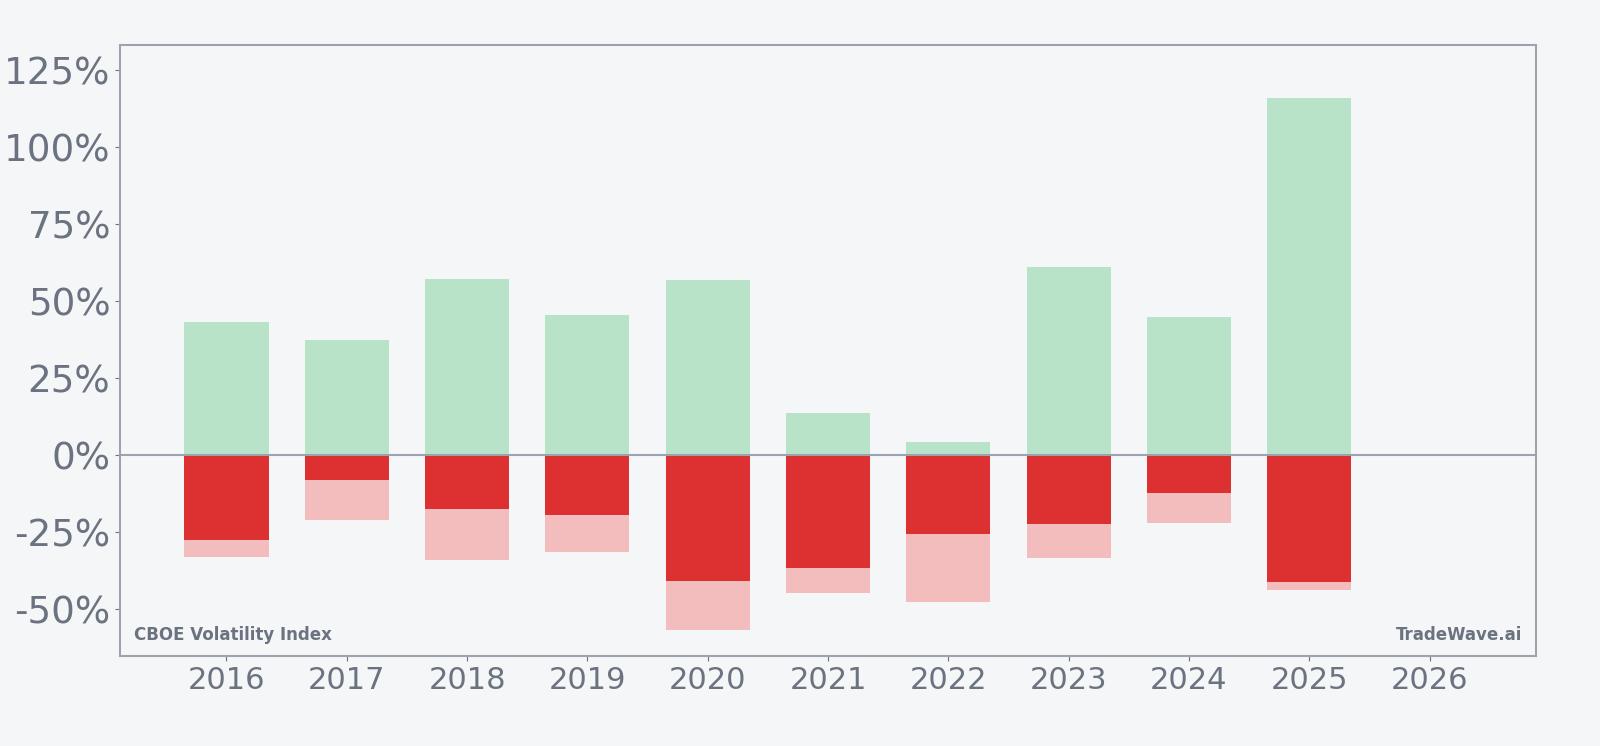
Intraperiod behavior has been anything but quiet. Maximum favorable moves, defined as the best point-to-peak move in the trade direction during the window, have reached 57.26% in 2018 and 115.83% in 2025 as volatility spikes ultimately faded. On the other side, maximum adverse excursions, the worst drawdowns from entry, have been deep in several years, including a 56.78% move against the short in 2020 and a 47.48% adverse swing in 2022 before VIX rolled over.
That mix of large positive and negative excursions is captured in the TradeWave Ratio of 2.07, which measures how far price typically travels in the trade direction within the window, independent of the final close. In plain English, when this window moves, it tends to move a lot, and the short side has historically been the place to be, but the path has often involved sharp volatility spikes before the eventual fade.
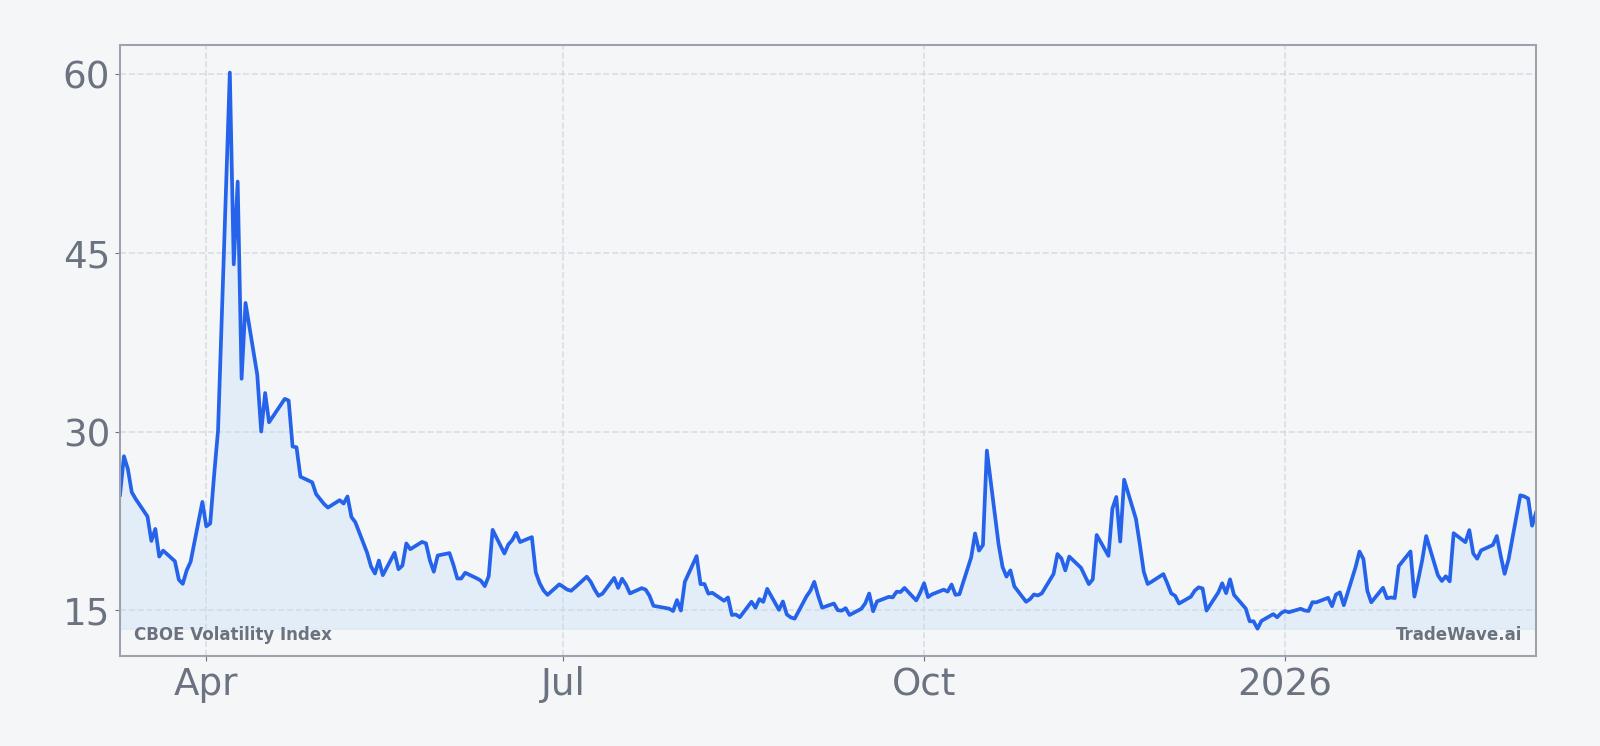
The 10-year seasonal trend profile shows that the typical pattern is front-loaded turbulence followed by a more persistent grind lower in implied volatility. Early in the window, VIX has often seen one or more sharp jumps that test short positions, but by the midpoint the average path bends decisively lower, with much of the cumulative return accruing in the back half of the 126 days.
A combined view of yearly net returns with peak favorable and adverse moves shows how often volatility spikes have ultimately reversed within this window.
History does not guarantee future results; adverse excursions (MAE) can be large even in winning windows.
Price and near-term drivers
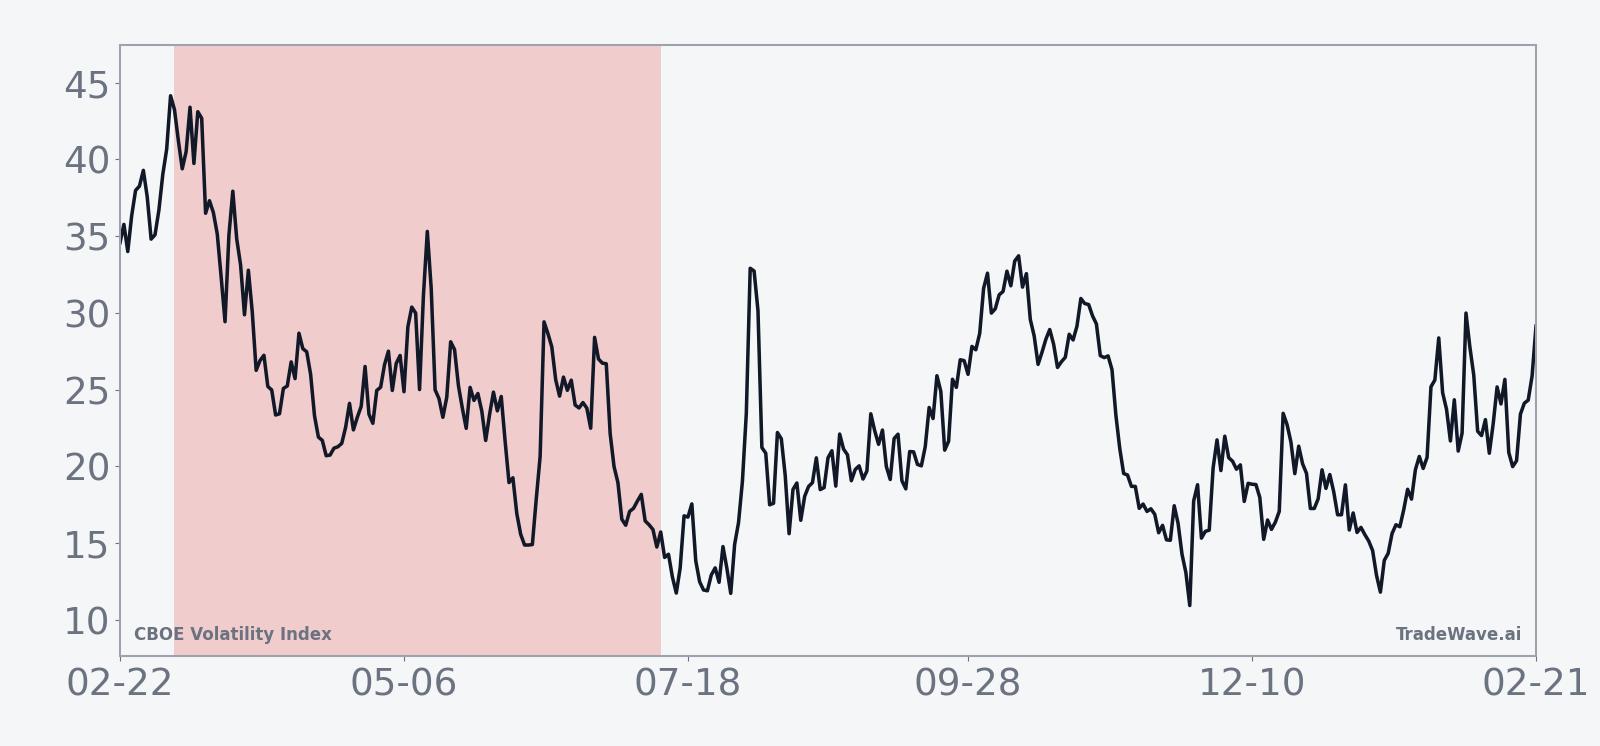
VIX last closed at 25.5, down 13.53% on the day and sharply below its recent intraday high of 35.3, yet still elevated versus its 52-week low of 13.38. Over the past month the index is up 46.89%, underscoring how quickly implied volatility can surge even when the longer seasonal tendency points lower. That tension between a strong short-volatility seasonal window and a still-elevated starting level is what makes this year’s setup so sensitive to macro headlines.
The chart below situates the latest move in its recent multi-month context.
In 2025, tariff disputes and US-China trade tensions repeatedly pushed VIX toward crisis levels, with the index surging above 40 as investors scrambled for downside protection in options markets.[1] Those episodes showed how quickly macro shocks can overwhelm any calendar pattern, even if the eventual path later fell back in line with the historical tendency for volatility to compress once the immediate fear passed.
Macro risk remains a key driver. Global market volatility has been elevated when trade and banking concerns flare, prompting hedging flows into VIX-linked products and options.[1] At the same time, the VIX futures curve has often signaled that these bursts of stress are expected to be short-lived, with near-term contracts trading at a premium to longer-dated ones during trade scares.[1] That structure is consistent with a market that expects volatility spikes but also expects them to fade, which fits the historical pattern of this 126-day window.
For equity investors, the relationship is straightforward: when VIX falls, it usually reflects calmer, better-supported stock markets, while sharp VIX spikes tend to coincide with abrupt equity drawdowns. The current setup, with VIX elevated but already retreating into a historically bearish window for volatility, leaves room for further compression if macro risks stay contained, but also for painful squeezes if new shocks hit before the seasonal pattern has time to assert itself.
What to watch in this window
The next several weeks will test whether this 126-day short-volatility window can repeat its 10-for-11 track record. The first sign that history is on track would be VIX failing to hold above the mid-20s and gradually grinding back toward the high teens, even if occasional headlines trigger brief spikes. A sustained move back toward the 52-week low near 13.38 would be consistent with the stronger historical years in the sample.
On the risk side, traders should watch for any break back above the recent intraday highs in the mid-30s, especially if accompanied by a steepening in the VIX futures curve that signals expectations for longer-lasting stress. That kind of move has historically lined up with the larger adverse excursions seen in years like 2020 and 2022, when short-volatility positions were tested hard before the eventual fade.
Macro catalysts remain the wild card. Renewed trade tensions, policy surprises, or credit concerns have previously driven VIX to rare levels above 40, forcing hedgers to chase protection and compressing the time it takes for volatility spikes to unfold.[1] If similar shocks emerge during this window, the historical pattern suggests they may still resolve into lower volatility by the end of the period, but the path could involve sharp, fast moves that challenge risk management.
Add it up: VIX is starting this 126-day stretch from an elevated perch, the long-term seasonal record strongly favors lower volatility by the end of the window, and the macro tape remains capable of producing sudden shocks. For traders, the opportunity is in knowing that this is not just another quarter for volatility, but one of the most consistently short-friendly windows on the calendar, with a history of big swings that eventually break in the same direction.