AI Chip Demand Wave Fuels Nvidia (NVDA) Outlook With Revenue Visibility Above $500 Billion
Nvidia is closing in on a historically favorable 14-day pattern in early February, with shares already sharply higher on the year and options markets signaling notable downside hedging into a busy AI and policy calendar.

Key takeaways
- Nvidia enters a 14-day seasonal window on Feb 2 that has historically been strong in midterm election years, with a long trade direction.
- The pattern has been profitable in 83% of the last six comparable cycles, with 5 winners and 1 loser across the sample.
- Average gains in winning years have been 6.96%, while the all-years average, including the lone losing year, is 5%.
- Historical paths show meaningful upside bursts but also notable intraperiod drawdowns, with both best-case rallies and worst-case pullbacks visible inside the window.
- The setup arrives as Nvidia trades higher on the year and remains central to the AI boom narrative, even as options markets have featured a large bearish bet targeting a drop toward $115 by early March.[13]
- Investors should treat the window as a historically supportive backdrop rather than a guarantee, with policy, earnings expectations and AI demand likely to shape how closely 2026 tracks the prior pattern.[3][5]
According to historical data from TradeWave.ai, Nvidia’s early-February behavior in midterm election years has followed a distinct seasonal script that differs from its performance in other parts of the presidential cycle.
Seasonal window
Nvidia is set to enter a historically strong 14-day seasonal window on Feb 2 that has tended to favor the long side in past midterm election years. The stock last traded at $177.99 on Jan 16, up about 51% year to date, leaving it well above levels seen during last year’s tech-sector pullback.[6] A large bearish options position established in late February 2025, targeting a move toward $115 by early March of that year, underscored how quickly sentiment can swing around this name when volatility picks up.[13] The combination of a supportive seasonal backdrop, elevated expectations and visible hedging activity creates a nuanced setup for one of the market’s most influential stocks.
Grouping the data by presidential election cycle means this pattern reflects Nvidia’s behavior in the last six midterm election years rather than in six consecutive calendar years. That focus is relevant in 2026 because midterm years often feature shifting policy expectations, evolving regulation around AI and semiconductors, and changing fiscal priorities, all of which can influence how investors treat high-growth, policy-sensitive names like Nvidia.
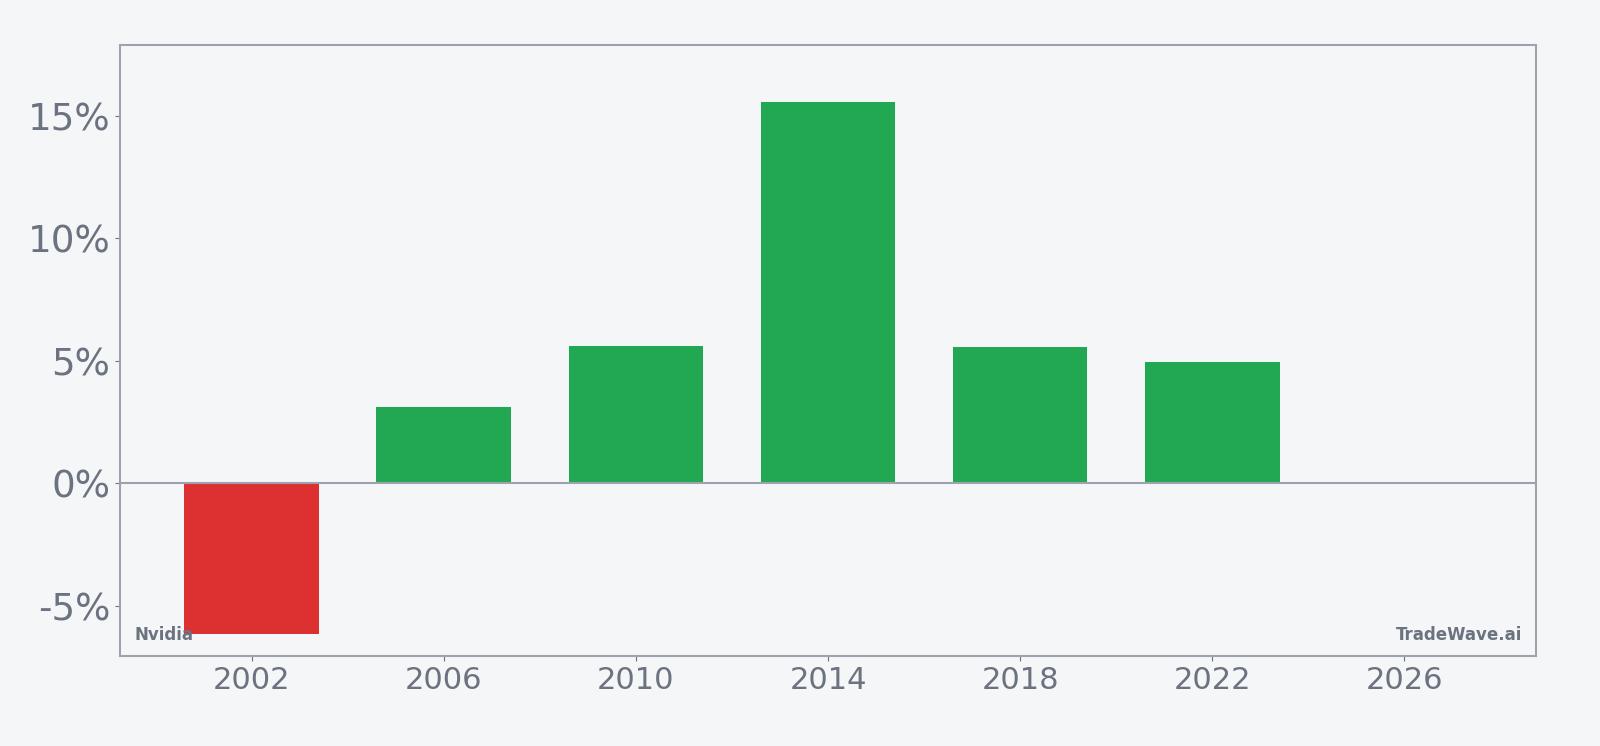
This seasonal window begins on 2026-02-02 and spans 14 days. Historically, during this period, Nvidia has shown a constructive directional tendency for long positions, with 83% of the sampled midterm-year windows ending higher and only one finishing in the red. The average gain in winning years has been 6.96%, while the average outcome across all six years, including the losing instance, is a still-positive 5%, which points to a pattern where setbacks have been the exception rather than the rule.
The per-year breakdown underscores that profile. The weakest year in the sample, 2002, saw a net loss of 6.15% over the window, with a best intraperiod rally of 4.83% and a worst drawdown of 9.28% from the entry level, illustrating that even losing years contained tradable upside swings alongside deeper downside pressure. At the other end of the spectrum, 2014 delivered a 15.56% net gain, with a maximum favorable move of 16.07% and only a 1.1% worst drawdown, a combination that highlights how powerful this stretch has occasionally been when the broader backdrop aligned.
Across the full sample, the historical maximum favorable excursion, or best point-to-peak move within the window, has often been meaningfully larger than the final net gain, while the maximum adverse excursion, or worst intraperiod drawdown, has varied from shallow to quite sharp. That mix suggests a window where price can travel a long way in the trade direction, consistent with a TradeWave Ratio of 1.71, but where investors have also had to tolerate volatility along the path. The standard deviation of 6.92% and a Sharpe ratio of 0.67 frame the pattern as historically positive but not smooth.
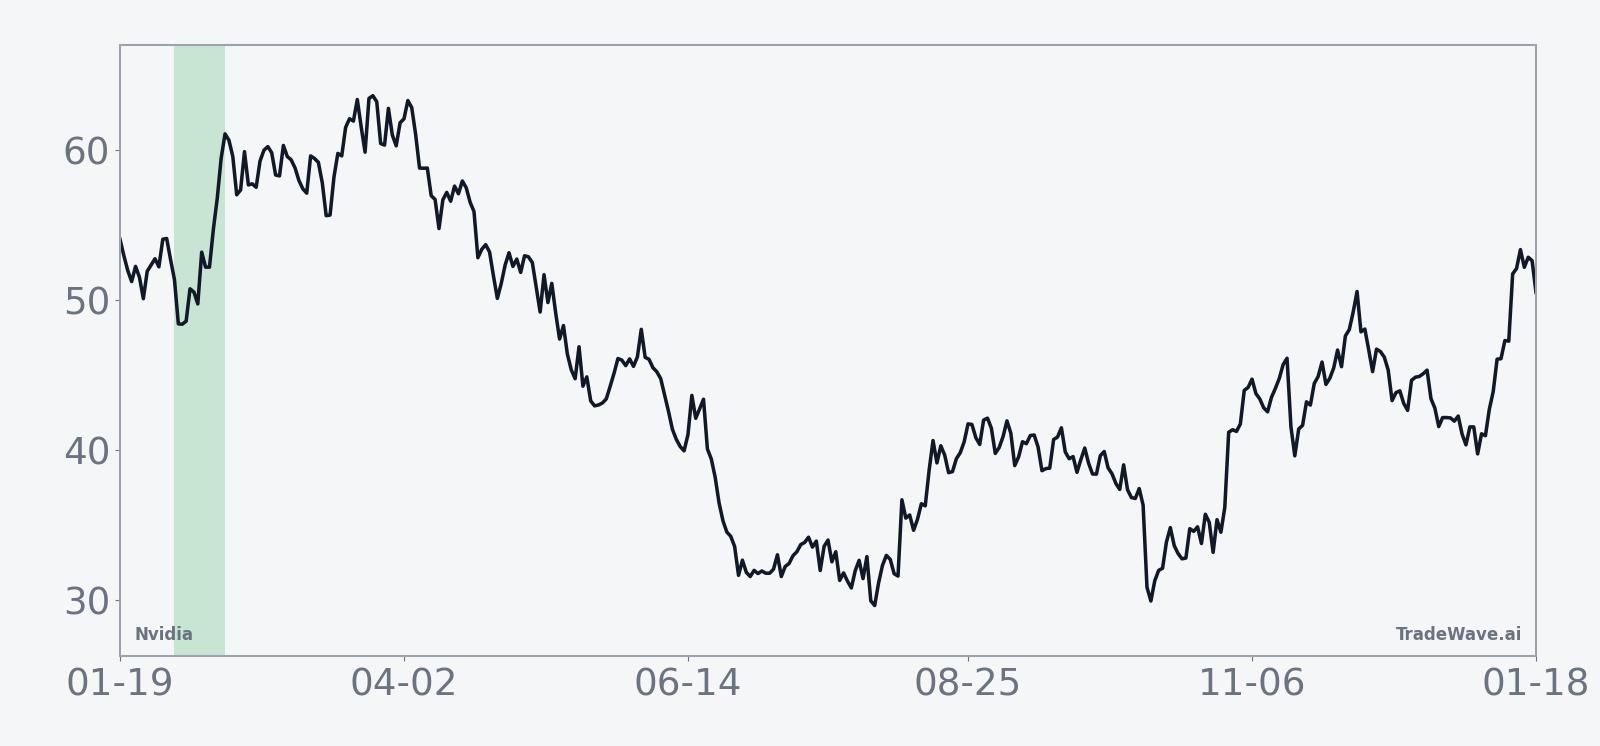
The historical seasonal trend chart shows gains tending to build over the course of the 14 days rather than arriving in a single spike, with several prior years featuring early strength that either consolidated or extended into the back half of the window. That pattern of gradual accrual, punctuated by occasional pullbacks, is consistent with a long-biased setup that has generally rewarded patience when volatility has stayed contained.
The combined net-return and excursion profile helps clarify how much upside and downside has historically been in play inside this window.
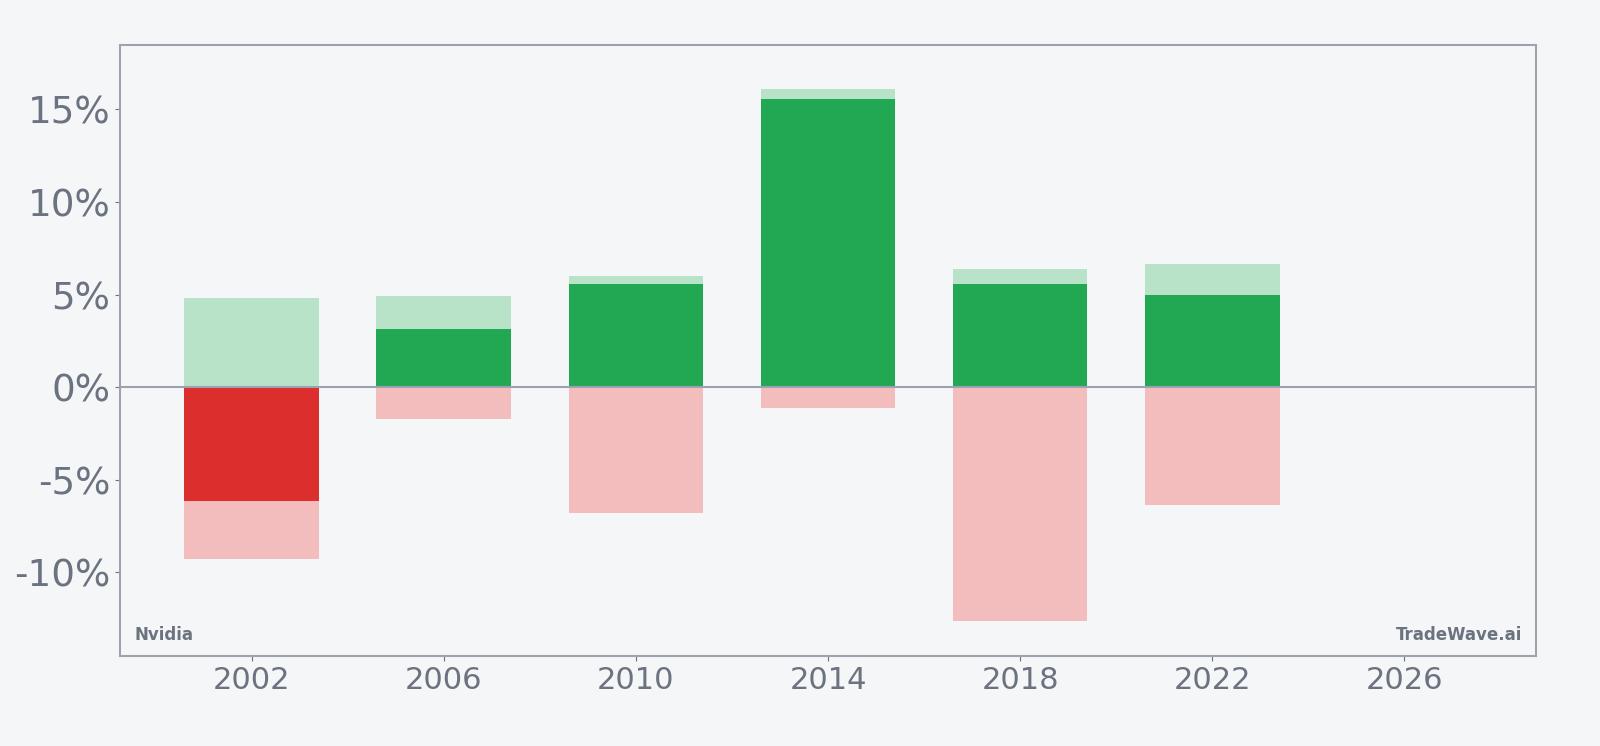
The stacked net, maximum favorable and maximum adverse bars show that even in winning years, Nvidia has often experienced noticeable pullbacks inside the window before finishing higher, while the lone losing year combined a sizable drawdown with only modest upside. Taken together, the historical pattern defines the quantitative seasonal backdrop for the current period.
History does not guarantee future results, and adverse excursions can be large even in winning windows, so investors should treat the pattern as context rather than a forecast.
Price and near-term drivers
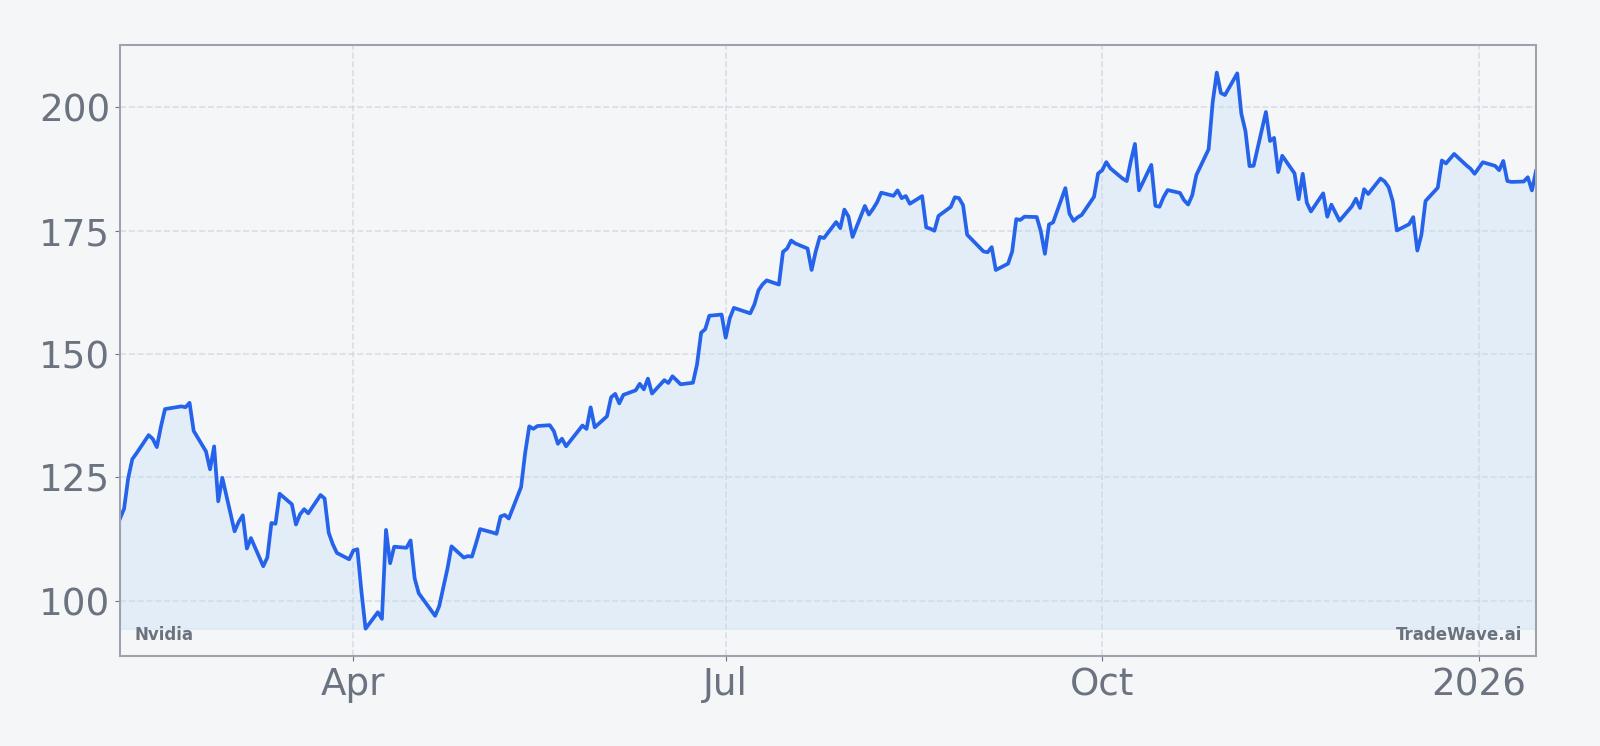
Nvidia’s latest close at $177.99 on Jan 16 leaves the stock significantly higher on the year, reflecting continued enthusiasm around its role at the center of the AI boom and expectations for robust demand for its data center GPUs.[5] In November 2025, the company reported quarterly revenue of $46.7 billion, up 56% year over year, with adjusted earnings per share rising 54% and management pointing to visibility into more than $500 billion in revenue through the end of the following year, reinforcing the growth narrative that has supported the share price.[3] That fundamental strength has been accompanied by bouts of volatility, including a period in February 2025 when options markets featured a massive bearish bet on a decline toward $115 by early March, highlighting how some investors have sought protection against sharp pullbacks even as the longer-term story has remained constructive.[13]
Macro and sector forces have added another layer to the setup. Reuters reported in November 2025 that options positioning around Nvidia’s earnings implied a potential $320 billion swing in market value, underscoring how central the stock has become to broader risk sentiment and index-level moves.[5] At the same time, Forbes noted in February 2025 that investors were bracing for a “massive” earnings report against a backdrop of elevated expectations, while separate analysis has pointed to periods when tech-sector pullbacks weighed on Nvidia even as AI demand stayed strong, reminding traders that positioning and macro conditions can temporarily overpower company-specific momentum.[6]
The chart below situates the latest move in its recent multi-month context.
Macro, policy and election-cycle context
The upcoming window falls in the early part of the midterm election year, a phase that often brings shifting expectations around regulation, fiscal policy and industrial strategy. For Nvidia, that backdrop intersects with debates over AI governance, export controls on advanced chips and potential incentives for domestic semiconductor investment, all of which can influence how investors value its future cash flows. In November 2025, Business Insider highlighted how analysts were focused on Nvidia’s Q3 earnings as a key barometer for AI demand, while Reuters emphasized the scale of potential market-cap swings tied to those results, reflecting the stock’s growing policy and macro sensitivity.[3][5]
Historically, midterm election years have displayed a “two-playbook” structure in broader markets, with choppier conditions early in the year followed by stronger performance as visibility on policy and the next presidential race improves. Nvidia’s early-February seasonal window, built from the last six midterm election years, sits in that first phase, where volatility has often been elevated even when the eventual outcome for the year was positive. The fact that this particular window has skewed bullish in prior cycles suggests that, for Nvidia specifically, early-year uncertainty has not prevented the stock from advancing during this stretch when AI demand and product cycles have lined up favorably.
What to watch as the window opens
As Feb 2 approaches, traders will be watching how Nvidia trades around several key catalysts. First, any updates on the company’s Blackwell, Blackwell Ultra and Vera Rubin chip roadmap, which analysts have flagged as important growth drivers into 2026, could influence whether this midterm-year window again aligns with a supportive product cycle.[3] Second, macro data and policy headlines that affect risk appetite for high-growth technology, including signals on regulation of AI and export controls, will help determine whether the broader environment resembles the stronger or weaker historical years captured in the seasonal sample.
Options and positioning will also be in focus. The large bearish bet highlighted by Bloomberg in February 2025 showed how quickly hedging demand can build when investors worry about downside in Nvidia, and a renewed pickup in protective put buying or skew ahead of or during the window would signal that some market participants are again bracing for volatility even against a historically positive seasonal backdrop.[13] Conversely, if options activity remains balanced and realized volatility stays contained while the stock respects key support levels on the chart, that would be more consistent with the smoother winning years in the pattern.
Finally, traders will be monitoring how Nvidia behaves relative to the broader tech sector and major indices. Reuters’ observation that earnings-related moves in the stock can translate into hundreds of billions of dollars in market-cap swings underscores its systemic importance, meaning that any sharp deviation from the historical seasonal tendency, whether to the upside or downside, could have implications beyond a single name.[5] For this 14-day window, the key signposts will be whether price action tracks the historical tendency toward gradual gains with manageable drawdowns, or whether early weakness, outsized intraperiod declines or unusually heavy hedging signal that 2026 is shaping up as one of the rarer years that diverge from the established pattern.
Sources
- [1] Barchart, “Analysts Have High Hopes for Nvidia Ahead of August 27. Should You Buy NVDA Stock Here?”, Aug 22, 2025
- [2] Barchart, “Nvidia Stock Just Got a New Street-High Price Target. Should You Buy NVDA Now?”, Oct 27, 2025
- [3] Business Insider, “Nvidia earnings updates: Analysts are bullish before Q3 results”, Nov 19, 2025
- [4] CNBC, “Nvidia will soar nearly 75% as GPU shipments double in the next year, says Loop Capital”, Nov 3, 2025
- [5] Reuters, “Nvidia set for $320 billion price swing after earnings, options indicate”, Nov 18, 2025
- [6] Forbes, “Here’s What To Expect From Nvidia’s ‘Massive’ Earnings Report”, Feb 26, 2025
- [7] MarketWatch, “Nvidia’s stock has a strong setup ahead of next week’s earnings, this analyst says”, Nov 13, 2025
- [8] Seeking Alpha, “Nvidia after selloff: Undervalued or further downside ahead?”, Mar 8, 2025
- [9] Nasdaq, “NVDA Quantitative Stock Analysis”, Mar 11, 2025
- [10] Seeking Alpha, “Nvidia's Q1 Detonation: Why This AI Juggernaut Is About To Rip Higher”, May 18, 2025
- [11] Bloomberg, “Nvidia (NVDA) Chart Watchers Brace for More Pain With Dip Buyers at Bay”, Mar 5, 2025
- [12] CNBC, “How to get income from Nvidia as chip giant could reach all-time high in near future”, May 16, 2025
- [13] Bloomberg, “Nvidia Decline to a Five-Month Low Is Day’s Biggest Options Bet”, Feb 27, 2025
- [14] Seeking Alpha, “Nvidia: Why A Sharp Breakout Might Be Imminent”, Jun 22, 2025