8-for-8: EOG Resources (EOG) Enters a 41-Day Midterm Spring Window Near 52-Week Highs
EOG Resources is stepping into a historically strong 41-day midterm-year stretch just below its 52-week high, giving traders a rare blend of bullish seasonality and elevated energy volatility.

Key takeaways
- EOG Resources is entering a 41-day seasonal window tied to midterm election years that has produced gains in all eight prior cycles.
- The pattern is long-biased, with an average profit of 10.85% across winners and no losing years in the sample.
- Today’s close at 127.89 leaves EOG about 4.8% below its 52-week high of 134.36 after a 12.31% one-month run.
- Historical intraperiod swings show meaningful drawdowns in some years even when the window finished higher, underscoring the need to respect volatility.
- The window sits in the early part of the midterm election year, when policy uncertainty and oil-price swings have often amplified moves in energy stocks.
According to historical data from TradeWave.ai, this specific midterm-year stretch has behaved very differently from an average spring for EOG Resources, and the next 41 trading days are where that pattern shows up most clearly.
Seasonal window
EOG Resources has risen in all 8 of the last 8 midterm election years during this 41-day window, averaging 10.85% gains for long positions. The window begins on Mar 11 and runs for roughly two months of trading, with the stock currently at 127.89 after a 12.31% one-month climb and sitting about 4.8% below its 52-week high of 134.36.
Grouping the data by the presidential election cycle matters here because energy policy, regulation and fiscal priorities tend to shift in recognizable ways across the four-year White House rhythm. Midterm years in particular often feature contentious debates over drilling permits, export policy and environmental rules, which can inject extra volatility into exploration and production names like EOG without necessarily changing the longer-term demand story.
This seasonal window begins on Mar 11 and spans 41 trading days. Historically, during this period in midterm election years, EOG Resources has shown a strong upside tendency for long exposure rather than a mixed or choppy profile.
The trade direction for this pattern is explicitly long. Across the last eight midterm election years that match this phase, the stock finished higher in every case, giving a Percent Profitable reading of 100% with 8 winners and 0 losers. Average profit across those winners is 10.85%, with a median gain of 12.52%, so the typical outcome has been a double-digit move rather than a marginal drift.
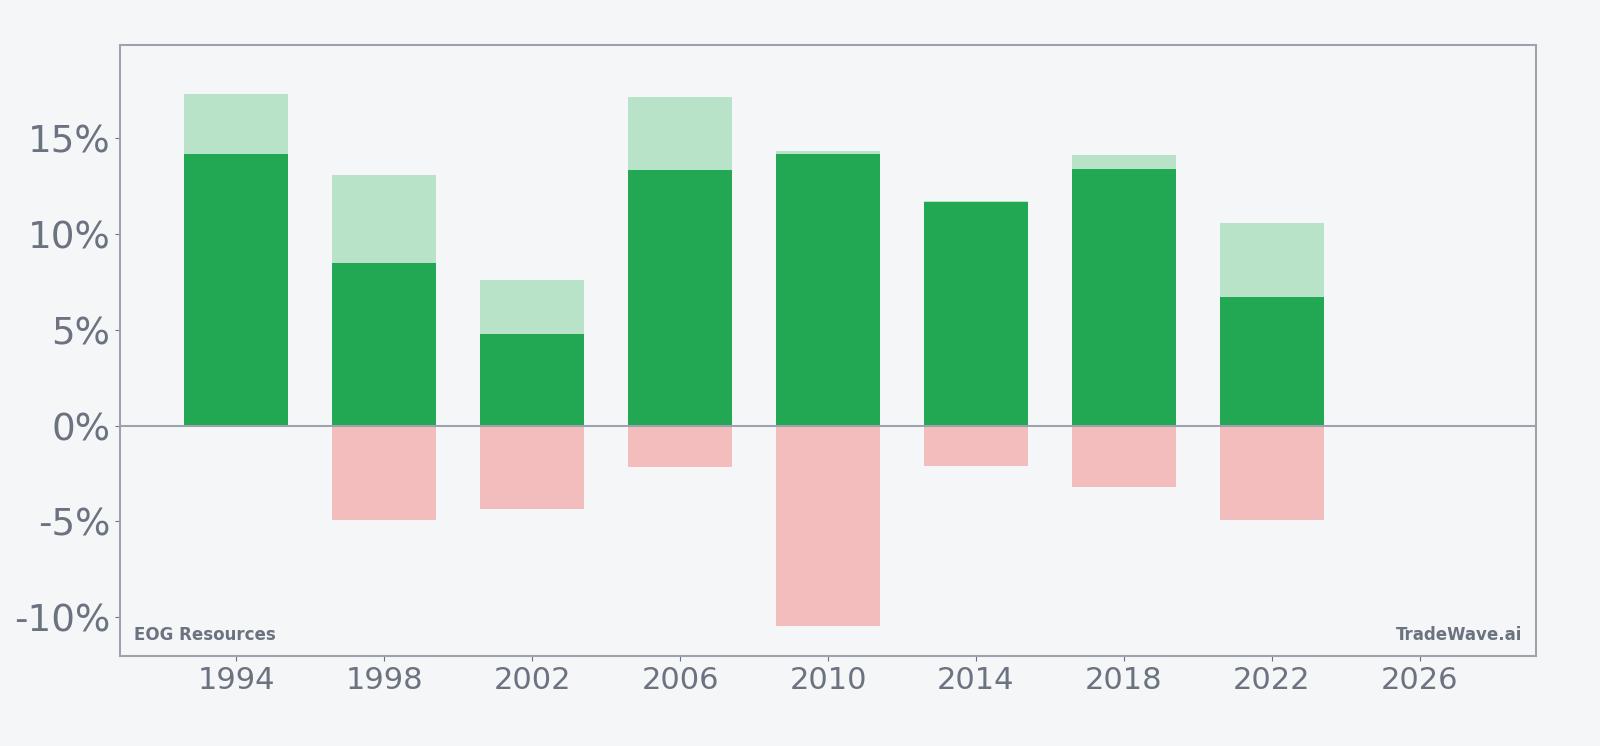
In plain English, that means the “average year” in this window has looked more like a solid rally than a grind. The strongest individual years in the sample, such as 2010 and 2018, delivered net returns of 14.21% and 13.42% respectively over the 41 trading days, while even the softest year, 2002, still finished up 4.79%.
Intraperiod swings have been meaningful. The best point-to-peak moves, known as maximum favorable excursions, ranged from 7.6% in 2002 to 17.3% in 1994, showing that when the pattern works, it often does so with a clear upside burst rather than a slow grind higher. On the downside, the worst intraperiod drawdowns, or maximum adverse excursions, have ranged from essentially flat in 1994 to about 10.48% in 2010, reminding traders that even winning windows have included sharp pullbacks along the way.
The TradeWave Ratio (TWR) for this setup is 3.92. TradeWave Ratio (TWR) reflects how far price typically travels in the trade direction within the window regardless of the final close. A reading near 4 in this context is consistent with a window where the stock has tended to make sizable runs in the long direction before the clock runs out.
Risk-adjusted performance has also been unusually strong. The Sharpe ratio for the pattern stands at 2.82, which is high for a single 41-day slice of the calendar and reflects the combination of consistent positive outcomes and relatively contained dispersion across years.
Looking at the day-by-day seasonal trend, the historical average path shows EOG often starting the window with a modest consolidation before gains accelerate into the middle of the period. Later days tend to see the curve flatten rather than reverse, suggesting that in prior midterm years, the bulk of the move has often been captured by the middle third of the window.
The cumulative return profile across all eight midterm-year samples adds up to a 127% total gain for this specific 41-day slice when you stack the years together. Add it up: eight cycles, no losing years and a triple-digit cumulative gain across this narrow calendar band.
Year-by-year bars with peak rallies and worst drawdowns show how consistently the window has favored longs while still delivering sizable swings.
History does not guarantee future results, and even in a perfect 8-for-8 window, adverse excursions have at times approached double digits before the trade finished higher.
Price and near-term drivers
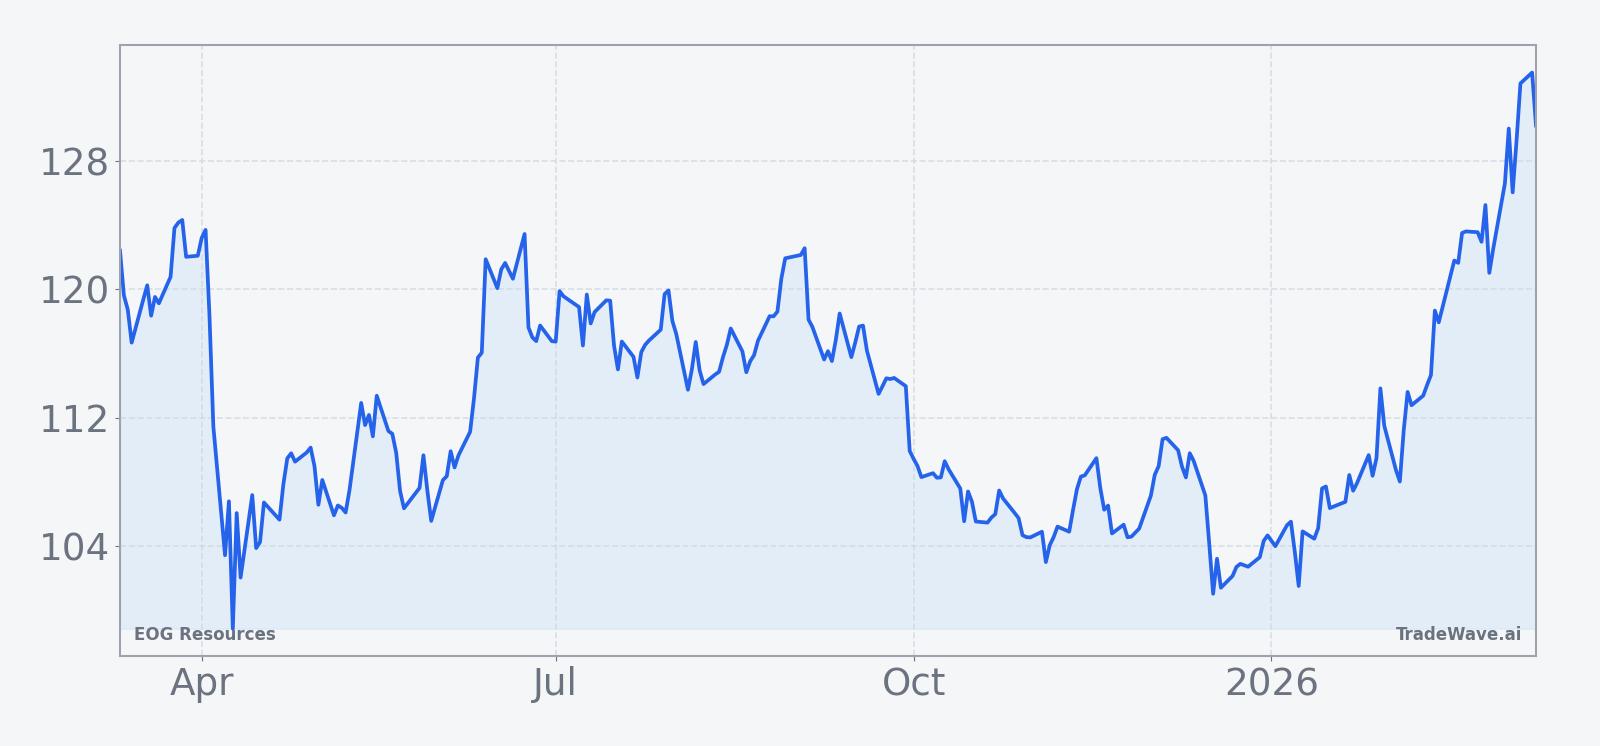
EOG Resources closed Wednesday at 127.89, down 2.87% on the day, after trading between 126.94 and 130.86 on volume of about 6.7 million shares. The stock has climbed 12.31% over the past month and sits just under its 50-day moving average of 113.85, with 20-day average volume running near 6.3 million shares, leaving it about 4.8% below its 52-week high of 134.36 and well above its 52-week low near 95.32.
That price backdrop comes after a year in which EOG leaned into scale and production growth. In Aug 2025, the company agreed to acquire Encino for $5.6 billion in a deal pitched as accretive to free cash flow and supportive of higher shareholder returns, including a 5% dividend increase.[1] On the same day, EOG reported adjusted income of $2.32 per share for the second quarter of 2025, topping estimates of $2.21 and lifting its full-year production forecast to 1.224 million barrels of oil equivalent per day from a prior range of 1.1 to 1.14 million.[1]
Later in 2025, EOG followed through on that capital-return message by raising its quarterly dividend by 5% to $1.02 per share, implying an annualized yield of 3.8% at the time.[1] That combination of higher volumes and a richer payout has helped keep the stock in focus for income-oriented investors who still want leverage to U.S. shale growth.
Macro conditions have been more challenging. Brent crude prices fell nearly 20% year-over-year into late 2025 as weaker demand met increased supply, a backdrop that can pressure realized prices even for efficient producers.[1] EOG’s strategy of boosting natural gas exposure and adding scale through Encino was framed as a way to navigate that softer tape while preserving balance-sheet strength and cash returns.[1]
The chart below situates the latest pullback against EOG’s broader 12-month climb and recent test of its highs.
Macro and election-cycle backdrop
The current seasonal window sits in the early part of the midterm election year, a phase that has often been choppier for risk assets than the presidential election year or the year after. For energy producers, midterm years can bring renewed scrutiny of drilling on federal lands, export policies and emissions rules, all of which can influence capital spending plans and investor sentiment even when commodity prices are driven by global forces.
For EOG, the Encino acquisition and higher production guidance announced in Aug 2025 signaled confidence in long-term demand and in the company’s ability to generate free cash flow through the cycle.[1] That stance could matter as the calendar moves from the midterm year into the year before the presidential election, a phase that has historically seen a more supportive policy and liquidity backdrop for equities in many cycles.
At the same time, the nearly 20% year-over-year slide in Brent crude into late 2025 showed how quickly macro conditions can shift for upstream names.[1] If global growth wobbles or supply remains abundant, even a historically strong seasonal window can play out with more volatility than the averages suggest.
What to watch in this window
For traders tracking this 41-day stretch, the first checkpoint is whether EOG respects the historical pattern of consolidating early in the window before building a stronger mid-period advance. A quick retest of the recent low near 126.94 followed by firm buying would be consistent with prior midterm-year paths, while a deeper break that fails to recover would mark a clear departure from the eight-for-eight record.
Second, watch how the stock behaves around the 52-week high at 134.36. In past cycles, the best years in this window have seen EOG push through nearby resistance and hold those gains into the end of the period. A clean move through that level on solid volume would fit the historical script of strong maximum favorable excursions, while repeated failures could signal that macro headwinds are starting to bite.
Third, keep an eye on macro headlines around oil and gas policy as the midterm election year unfolds. Any shift in expectations around drilling permits, export rules or environmental regulation could either reinforce or undercut the seasonal tailwind, especially given EOG’s expanded footprint and higher production targets coming out of the Encino deal.[1]
Finally, volatility inside the window will matter as much as the final outcome. Prior midterm-year samples have included intraperiod drawdowns approaching 10% even when the trade finished higher, so traders will be watching whether any pullbacks stay within that historical band or start to exceed it. If EOG can navigate policy noise and commodity swings while holding its pattern of mid-window strength, this spring stretch could once again look very different from an average month on the calendar.