Cautious Consumers Pressure Best Buy (BBY), but an 8-of-9 Spring Streak Is Back in Play
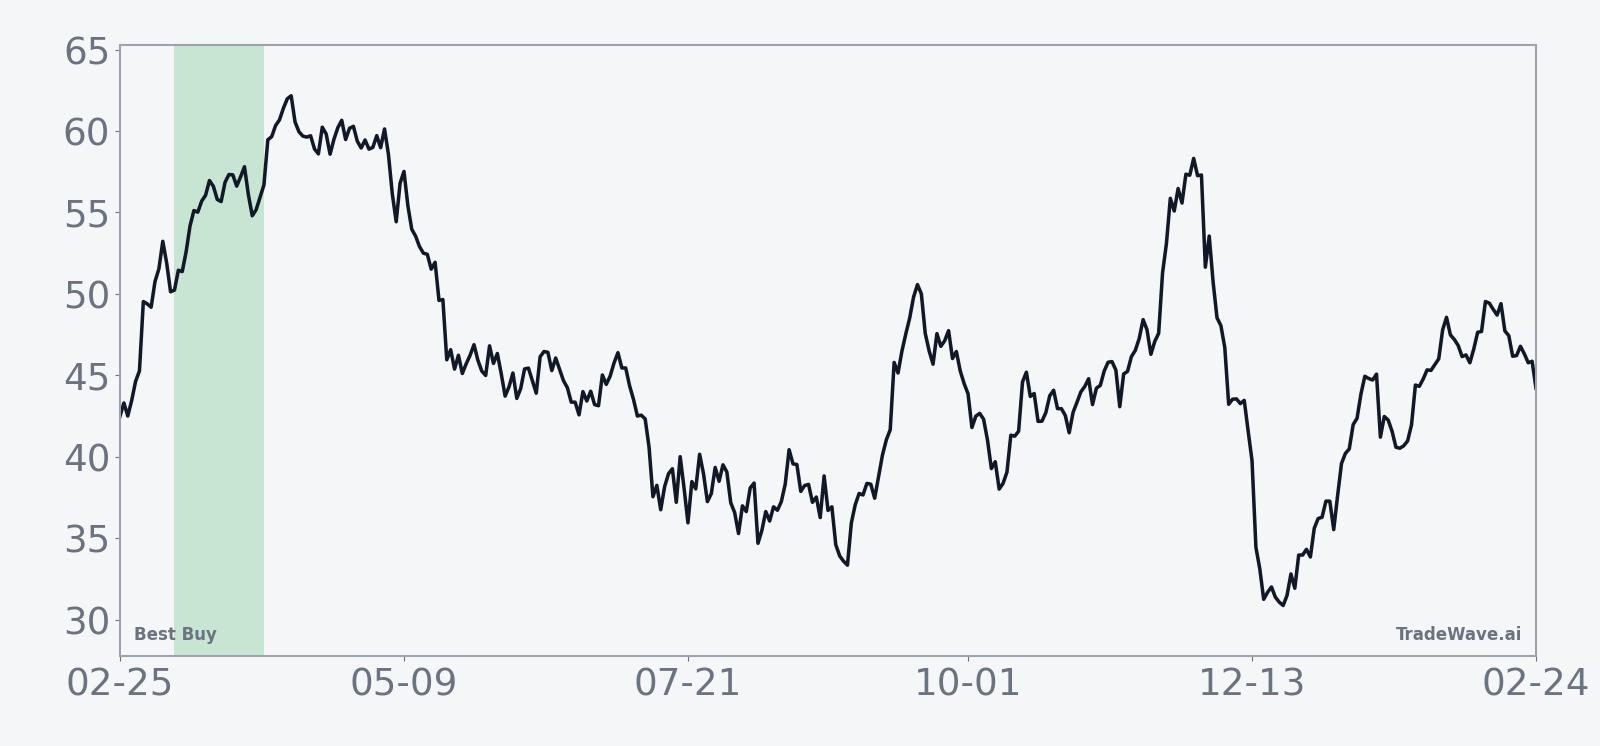
Best Buy is stepping into a historically strong 24-day midterm-year stretch even as the stock trades well below its 52-week high and faces a cautious consumer.

Key takeaways
- Best Buy’s 24-day window starting Mar 11 in midterm election years has been positive in 8 of the last 9 cycles, a historically strong long setup.
- Winning years in this window have averaged gains of 5.46%, while including the lone losing year still leaves an average outcome of 5% across all samples.
- The pattern is long-biased, with a Trade Direction of “long” and a TradeWave Ratio of 1.84, indicating meaningful travel in the trade direction inside the window.
- Intraperiod swings have been real: the worst year saw a maximum adverse move of -6.9% before recovering part of the loss, while strong years posted double-digit peak run-ups.
- Today’s price around $64.80 leaves Best Buy about 21.7% below its 52-week high, with the stock already down roughly 20% year to date.
- History favors upside in this slice of the calendar, but the combination of consumer caution and past drawdowns means traders still need to respect downside risk.
According to historical data from TradeWave.ai, this specific midterm-year window has behaved very differently from an average month for Best Buy, and the next 24 trading days will test whether that pattern still holds.
Seasonal window
Best Buy has risen in 8 of the last 9 midterm election years during this 24-day window starting Mar 11, with winning stretches averaging gains of 5.46%. Today the stock closed at $64.80, down 1.8% on the session and sitting about 21.7% below its 52-week high of roughly $82.79, after a year-to-date slide of about 20%.
Grouping the data by the presidential election cycle matters here because consumer electronics spending often tracks policy-sensitive themes like tariffs, tax refunds and credit conditions, which tend to follow a repeatable rhythm across election years. This pattern looks only at the last nine midterm election years, so it compares Best Buy’s behavior against periods when Washington was in the same phase of the political and policy calendar as today.
This seasonal window begins on Mar 11 and spans 24 trading days. Historically, during this period in midterm election years, Best Buy has shown a strong upside tendency for long positions rather than a mixed or choppy profile.
The trade direction for this pattern is explicitly long. Across the nine midterm-year samples, 8 were winners and 1 was a loser, giving a Percent Profitable reading of 89% with 8 winners and 1 loser. Avg Profit of 5.46% reflects only the winning years, while Avg Profit - All of 5% includes every year in the sample, including the losing one.
The Sharpe ratio for this window is 0.88, which is solid for a 24-day slice of time, and the TradeWave Ratio (TWR) of 1.84 reflects how far price typically travels in the trade direction within the window regardless of the final close. In plain English, when this window has worked, it has not just drifted higher; it has tended to move with some conviction.
Intraperiod swings have been meaningful. In the strongest years, Best Buy’s maximum favorable move, or best point-to-peak run-up during the window, reached into the mid-teens in percentage terms, while the worst year still saw a small positive peak before rolling over. On the downside, the maximum adverse move, or worst drawdown from entry, has ranged from shallow pullbacks of around 1% to a hit of -6.9% in 2018 before the stock clawed back part of the loss by the end of the window.
The per-year history shows how that plays out in practice. In 1998, for example, Best Buy logged a net gain of 13.38% in the window, with a maximum favorable excursion of 15.65% and only a mild intraperiod dip. By contrast, 2018 was the lone losing year, finishing down 1.74% after a modest 1.8% peak run-up and a much deeper -6.9% drawdown at the worst point.
The historical seasonal trend chart for this window slopes higher on average, with much of the typical gain accruing steadily rather than in a single spike. That suggests prior midterm-year iterations have often rewarded patience across the full 24 days instead of demanding perfect timing on entry or exit.
The cumulative return profile across the nine midterm-year samples adds up to a 49% total gain for this window, which is notable for such a short slice of the calendar. Add it up: nine midterm-year windows, one loser, and nearly half again as much value created across the full history of this pattern.
A second view of yearly net, best-case and worst-case moves shows how upside and drawdowns have lined up across cycles.
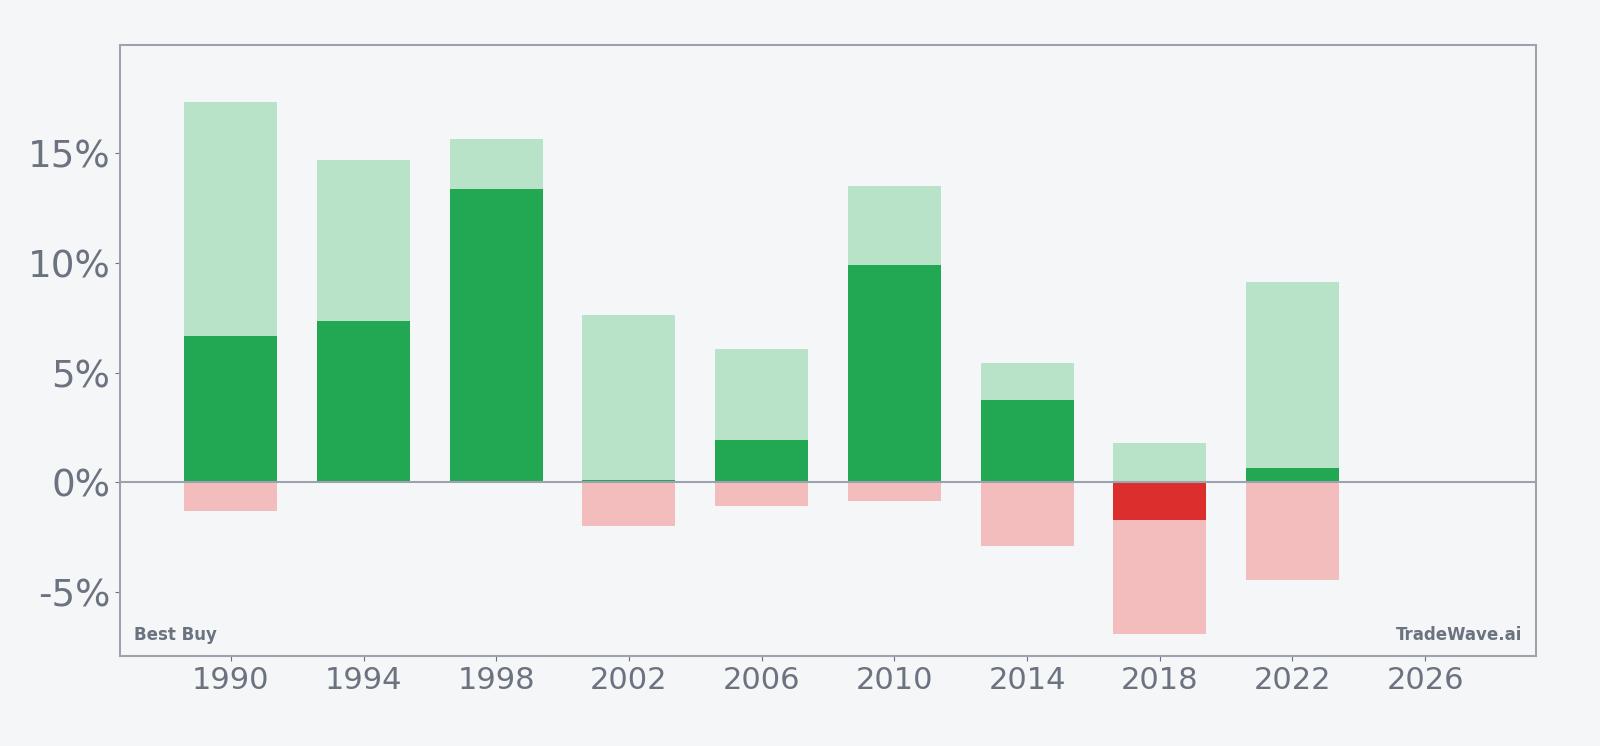
History does not guarantee future results, and even in winning years the worst intraperiod drawdown (MAE) has sometimes been large enough to challenge conviction.
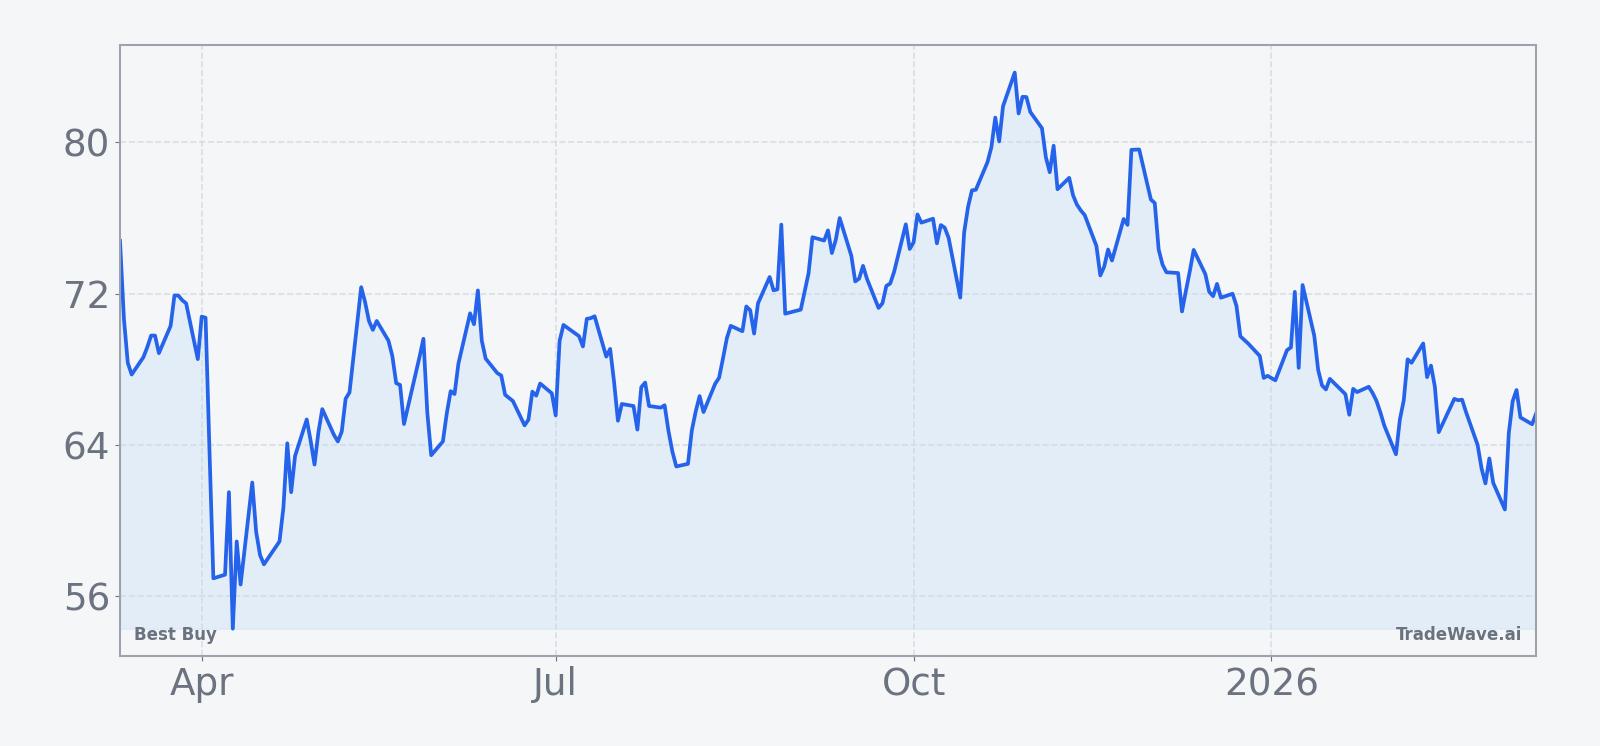
Price and near-term drivers
Best Buy shares finished Wednesday at $64.80, down 1.16 points or 1.8% on the day, extending a choppy stretch that has left the stock about 21.7% below its 52-week high near $82.79 and roughly 27.6% above its 52-week low around $50.79. The stock is down about 20% so far in 2026, underperforming many large-cap retailers as investors weigh softer electronics demand and a still-cautious consumer backdrop.[6]
The chart below situates the latest move in its recent multi-month context.
In early March, Best Buy appeared on lists of stocks making notable premarket moves, reflecting how sensitive the name has become to shifts in sentiment around consumer spending and big-ticket purchases.[6] The company is still digesting a period of flat to slightly negative sales growth, with earlier fiscal 2026 commentary pointing to modest revenue declines and pressure on earnings as shoppers pull back on appliances and home theater while gaming and mobile help offset some of the weakness.[1][3]
Macro headwinds have not gone away. Elevated inflation and tariff-related cost pressures have pushed up household expenses, encouraging more selective spending on discretionary electronics and squeezing retailer margins.[1][2] Sector commentary through late 2025 described a tough backdrop for electronics chains, with softer demand and tighter pricing power weighing on growth expectations for Best Buy and its peers.[2][3]
Earlier in the current fiscal cycle, analysts highlighted the potential for new console launches such as Nintendo’s next-generation Switch to provide a short-term lift to traffic and ticket size, even as the broader spending environment stayed sluggish.[3] At the same time, some research framed Best Buy as vulnerable in a downturn scenario, arguing that a sharp macro shock could still trigger a much deeper drawdown from prior peaks.[10]
Analyst views remain cautious rather than outright bullish. A consensus “Hold” rating and a blended price target around $81 from sources including Forbes and LSEG suggest Wall Street sees upside from current levels but is not ready to call for a clean growth re-acceleration.[3][10] That target also reflects a different price regime from mid-2025, when the stock traded higher, so investors are treating it more as a directional marker than a precise roadmap.
From a positioning standpoint, the seasonal window now in play sits inside the midterm election year, a phase that often brings policy noise around tariffs, consumer relief measures and credit conditions. For a retailer like Best Buy, that mix can translate into short bursts of optimism when policy headlines break in its favor, even if the underlying demand trend is only slowly improving.
What to watch in this window
For the next 24 trading days, the key test is whether Best Buy behaves anything like its prior midterm-year playbook. Historically, the stock has tended to grind higher across the full window rather than spike early and fade, so traders will be watching for a steady bid rather than a one-day pop.
On the macro side, any fresh data on inflation or consumer confidence that shifts expectations for discretionary spending will matter, especially if it changes the narrative around big-ticket purchases and financing costs. Policy headlines on tariffs or import costs could also move the stock quickly, given past sensitivity of electronics margins to those levers.[1][2][5]
Technically, the first reference points are the recent lows near the mid-$60s and the 50-day moving average around $66.65. A push back through that moving average during the window would line up with the historical pattern of midterm-year strength, while a break back toward the low-$50s would look more like a repeat of the 2018-style losing year.
Finally, watch how any upcoming company commentary or channel checks around categories like gaming, mobile and appliances land with investors.[3] If the stock can absorb cautious headlines without revisiting its worst historical drawdowns for this window, it would reinforce the idea that the midterm-year seasonal tailwind is still in play. If, instead, negative news triggers outsized downside that resembles the deeper historical MAE readings, it would signal that macro and sector pressures are overpowering what has been one of Best Buy’s more reliable calendar stretches.
Sources
- [1] Forbes, "Will Earnings Results Move The Needle For Best Buy?", May 28, 2025
- [2] Forbes, "Best Buy Stock: Where's The Growth?", Oct 21, 2025
- [3] Forbes, "Will Switch 2 Sales Lift Best Buy Stock Out Of Turbulence?", Jun 16, 2025
- [4] Forbes, "Best Buy Stock Is Sliding: Will You Still Hold It?", Dec 30, 2025
- [5] The Wall Street Journal, "Best Buy Raises Outlook As Consumers Shrug Off Tariff Costs", Nov 25, 2025
- [6] CNBC, "Stocks making the biggest moves premarket: Target, Best Buy, MongoDB, Credo Technology & more", Mar 3, 2026
- [7] Forbes, "Is A 50% Plunge On The Horizon For Best Buy Stock?", Jun 2, 2025